Uncorrelated Doesn't Mean Unrelated
Two variables can be uncorrelated (zero linear correlation) but still strongly related through a nonlinear relationship. Correlation only detects linear associations, not all forms of dependence.
THE IDEA
UNCORRELATED DOESN’T MEAN UNRELATED
When two variables are correlated, we’ve seen that they’re somehow related to each other. So what if they’re not? Does that mean the variables are completely unrelated, neither one affecting the other? Far from it. Galton’s notion of correlation is limited in a very important way: it detects linear relations between variables, where an increase in one variable tends to coincide with a proportionally large increase (or decrease) in the other. But just as not all curves are lines, not all relationships are linear relationships.
Take this one:
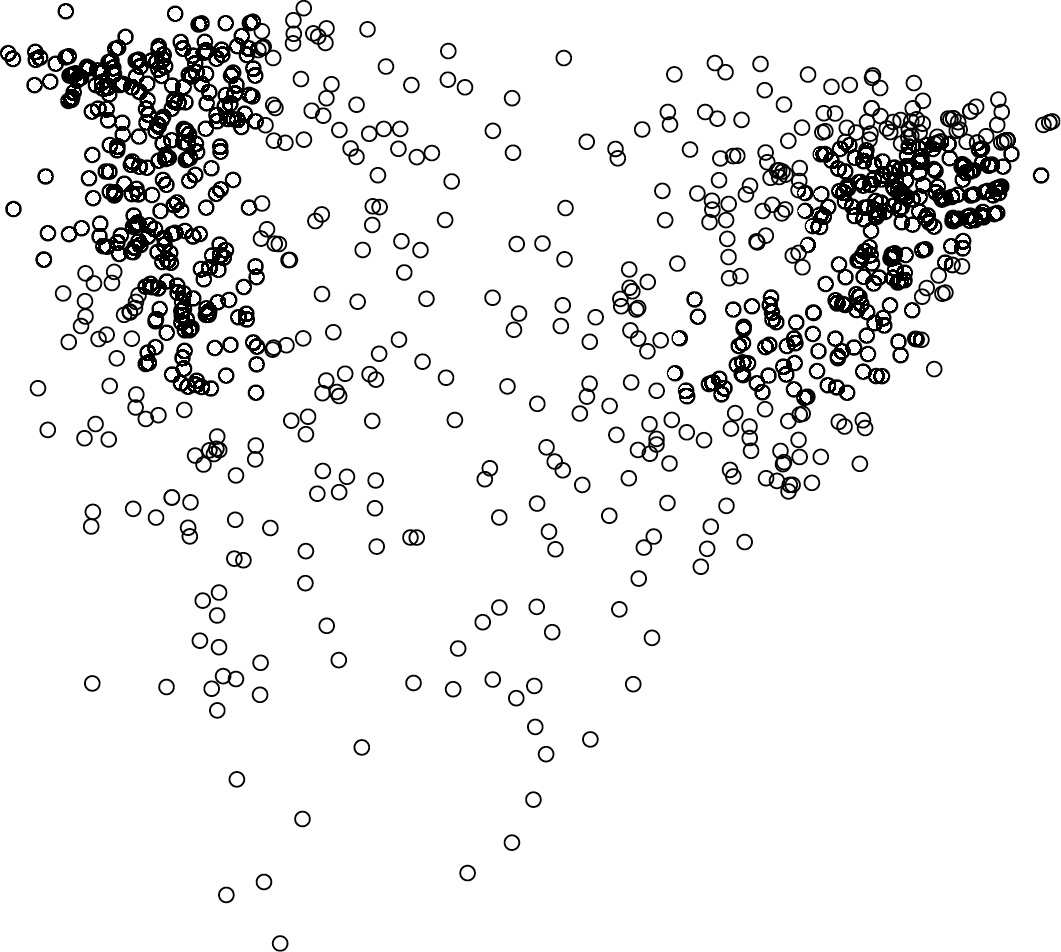
You’re looking at a picture I made of a political survey taken by Public Policy Polling on December 15, 2011; there are one thousand dots, each representing a voter who responded to a twenty-three-question poll. The position of a point on the left-right axis represents, well, left and right: people who said they supported President Obama, approved of the Democratic Party, and opposed the Tea Party tend to be on the left-hand side, while those who favored the GOP, disliked Harry Reid, and believed there is a “War on Christmas” are over on the right. The vertical axis stands roughly for “informedness”—voters toward the bottom of the graph tended to answer “don’t know” to more insidery questions like “Do you approve or disapprove of the job [Senate Minority Leader] Mitch McConnell is doing?” and to express little or no excitement about the 2012 presidential election.
One can check that the variables measured by two axes are uncorrelated,* just as eyeballing the graph suggests; it doesn’t look like the points tend to be farther left or right as you move up the page. But that doesn’t mean that the two variables aren’t related to each other. In fact, the relation is quite clear from the picture. The plot is “heart-shaped,” with a lobe on either side and a point at the bottom. As the voters get more informed, they don’t get more Democratic or more Republican, but they do get more polarized: lefties go farther left, right-wingers get farther right, and the sparsely populated space in the middle gets even sparser. In the lower half of the graph, the less-informed voters tend to adopt a more centrist stance. The graph reflects a sobering social fact, which is by now commonplace in the political science literature. Undecided voters, by and large, aren’t undecided because they’re carefully weighing the merits of each candidate, unprejudiced by political dogma. They’re undecided because they’re barely paying attention.
A mathematical tool, like any scientific instrument, detects some kinds of phenomena but not others; a correlation computation can’t see the heart-shapedness (cardiomorphism?) of this scatterplot any more than your camera can detect gamma rays. Keep this in mind when you’re told that two phenomena in nature or society were found to be uncorrelated. It doesn’t mean there’s no relationship, only that there’s no relationship of the sort that correlation is designed to detect.
When to use it
Analyzing political opinion data where voters' positions become more extreme with increased knowledge, even though average ideology doesn't shift with informedness.
In psychology, examining the relationship between stress and performance, which often follows a U-shaped (Yerkes-Dodson) curve rather than a linear one.
In health research, evaluating the association between a risk factor and disease incidence when the relationship is non-linear (e.g., J-shaped, threshold effects).
Checking for non-linear patterns in scatterplots before concluding two variables are independent in any scientific or business context.
FROM THEORY TO EVERYDAY LIFE
In practice
Political Polarization and Informedness
A 2011 Public Policy Polling survey of 1,000 voters plotted political orientation against informedness. The scatterplot is heart-shaped: as informedness increases, voters become more polarized (leftists move further left, rightists further right), yet the two variables are linearly uncorrelated. Correlation does not detect this nonlinear relationship.
A MOMENT TO REFLECT
Put it to work.
Can you recall a situation where two variables you assumed were unrelated actually had a nonlinear relationship? How could you detect it?
Why might it be dangerous to conclude two things are unrelated just because they are uncorrelated?
Identify a real-world example where a nonlinear relationship is masked by a lack of linear correlation.
Often confused with
CONTINUE THE CONVERSATION
Source texts
- How Not to Be Wrong The Power of Mathematical Thinking (Ellenberg, Jordan)