Systems Thinking with Causal Loop Diagrams
Systems thinking, using causal loop diagrams, helps simplify complex problems by mapping key factors and their interactions, as illustrated by the 2007–2008 financial crisis. This approach reveals how multiple causes interact and allows for prediction of potential cascading failures.
THE IDEA
A Systems Perspective on the Financial Crisis of 2007–2008
Let's consider the 2007–2008 financial crisis and imagine we can talk to experts in the field. You could ask them to identify some of the main ‘ingredients’ involved in what happened. They might explain these were (1) the property market, (2) the availability of easy credit (via sub‑prime loans/mortgages) and (3) how mortgages were turned into securities.
Then, you could then ask them to explain the links between these ingredients and add some others, such as (I) credit ratings standards, (II) the amount of capital to loans for each bank (i.e. ‘leverage’) and (III) processes used to assess any risks.
You could also ask the experts to explain the key risks that might arise from all these elements or systems. They might explain they were (i) the complexities of turning mortgages into securities, (ii) potential errors in risk assessments for liquidity, (iii) how the rules worked around bank balance sheets (e.g. the levels of ‘leverage’ allowed.), etc.
Already, you could easily feel overwhelmed; but when you start thinking about systems, I advocate avoiding getting drawn into an Alice in Wonderland world of complex explanations and words you may not understand. Instead, I recommend a KISS approach, where you see all the building blocks in play, but that doesn't mean you need to understand every one of these in detail.16 And in the end, with the right help, you might get someone to draw out some of the key factors in the 2007–2008 crisis using a simple one‑page diagram (see Diagram 3.3).17
Of course, the causal loop diagram does not contain every factor that influenced what happened, as denoted by the boundary chosen around the diagram. However, it is a ‘starter for 10’.
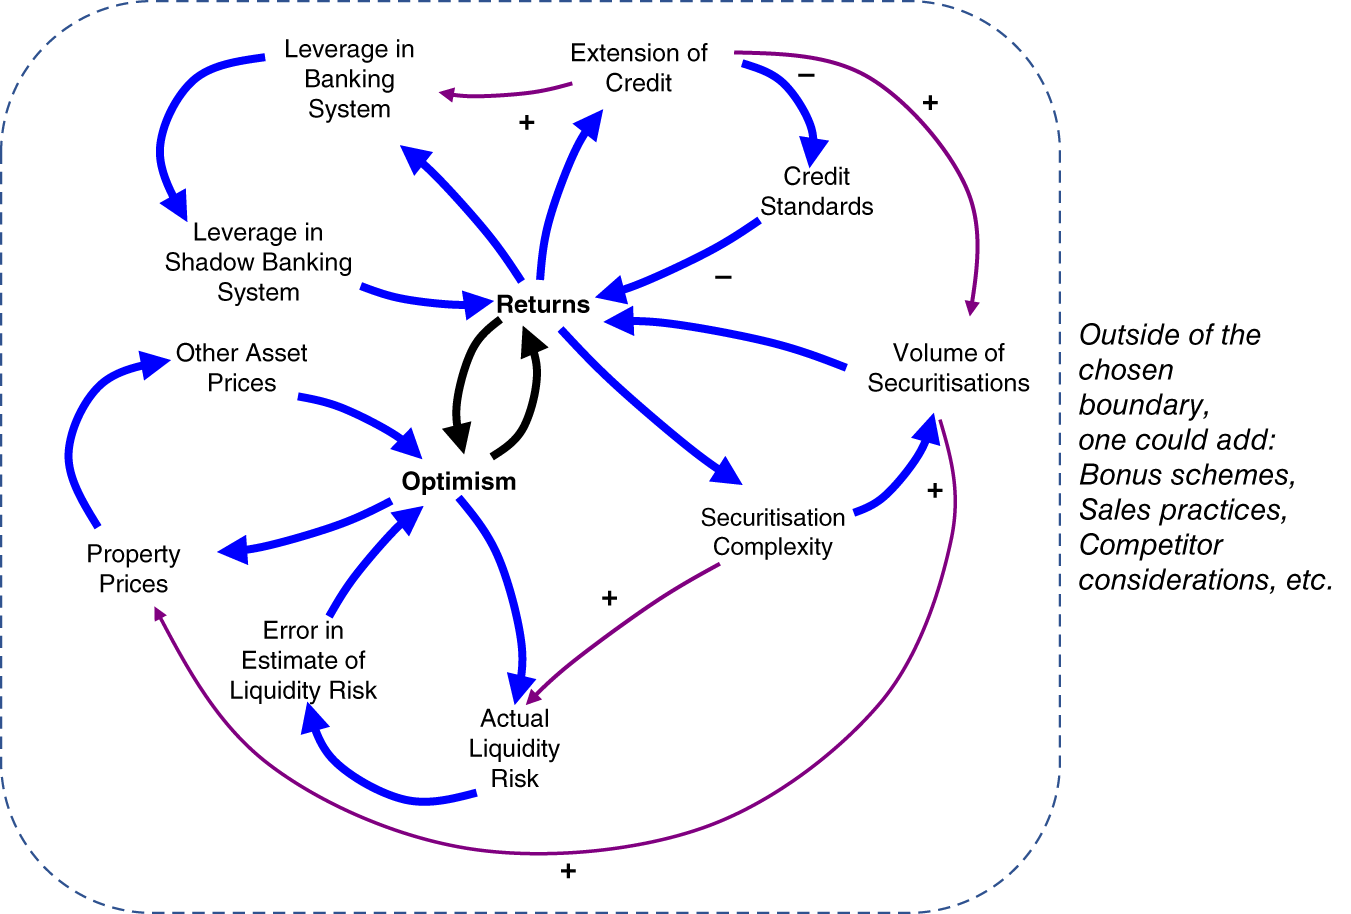
Diagram 3.3 Causal loop analysis – 2007–2008 financial crisis
And we might learn that during the early 2000s a whole host of elements, decades in the making, were on an upward, positive cycle, and any problems with the financial system were thought to be theoretical. But then there was an increase in interest rates, a fall in US property prices, resulting in a cascade of problems, one after the other, at breakneck speed. A former bank CEO, reflecting on what happened, said, ‘We wondered if we broke the financial system’.18
For the purposes of this overview discussion it’s not necessary to understand Diagram 3.3 in detail but rather note how a multi‑faceted, complex set of causes and effects can be made relatively digestible when you think in terms of systems and use causal loops, revealing how ‘one thing might lead to another’.
And while Diagram 3.3 was created after the 2007–2008 financial crisis, it could have been created beforehand, because there was a clear awareness of liquidity risks and the potential for a cascade of knock‑on problems before the crisis. As Citibank's then‑CEO Chuck Prince said months before things fell apart: ‘When the music stops, in terms of liquidity, things will be complicated. But, as long as the music is playing, you've got to get up and dance’.19
And so, we have a relatively straightforward illustration of
- why it's problematic to say the 2007–2008 financial crisis arose because of just one, or even two or three, root causes,
- how it would have been possible (and was possible) to predict much of what might happen before the full scale of problems arose 20 and
- why, after the crisis, so many aspects of financial services customs and practices and regulations, and regulatory oversight had to be changed?21
To reiterate, this book isn't a detailed ‘how to’ guide on systems thinking or causal loops. Instead, I hope I have illustrated that looking at things this way can provide a means to talk about and begin to grasp a complex problem in a way that reading a detailed 20‑page, or 200‑page, analysis with tables of numbers might not. Of course, the 20‑page, or 200‑page, analysis may be helpful and interesting for some people and in some circumstances, but the danger is that too much complexity means most people can't engage with, contribute to, or challenge, what is being said and, perhaps most important of all, understand what is not being said.
When to use it
Analyzing the causes of a business decline or market shift.
Understanding policy impacts in economics or social systems.
Evaluating risks in a project by mapping dependencies and feedback loops.
Teaching complex subjects by using simple diagrams to illustrate interactions.
FROM THEORY TO EVERYDAY LIFE
In practice
Financial Crisis Causal Loop Example
The 2007–2008 financial crisis can be modeled with causal loop diagrams showing how property market, easy credit, mortgage securities, credit ratings, leverage, and risk assessments interact. For example, rising interest rates and falling property prices triggered a cascade of defaults, liquidity problems, and bank failures. This example shows how systems thinking can simplify a complex event into manageable relationships.
Chuck Prince's 'Music Playing' Analogy
Citibank CEO Chuck Prince said: 'When the music stops, in terms of liquidity, things will be complicated. But, as long as the music is playing, you've got to get up and dance.' Short-term incentives encouraged ignoring systemic risks, a key insight from the systems perspective of the crisis.
A MOMENT TO REFLECT
Put it to work.
Think of a complex problem in your work or life. What are the key elements and how do they influence each other? Could a causal loop diagram help you see the bigger picture?
How might too much detail or complexity prevent you from engaging with a problem? Can you identify a situation where a simpler model would have been more useful?
What signals or feedback loops in a system you belong to (e.g., market, team, ecosystem) might indicate an impending change or failure?
Often confused with
CONTINUE THE CONVERSATION
Source texts
- Beyond the Five Whys Root Cause Analysis and Systems Thinking (James C. Paterson)