Winner's Curse
In research, the winner’s curse occurs when selecting results for statistical significance favors unusually large estimates. A small study may pass the threshold partly because chance exaggerated its effect, so a later study finds a smaller effect or none. Selective publication and p-hacking can make this problem worse, but deliberate manipulation is not required.
THE IDEA
The Winner's Curse in Science
A study published in a psychology journal reported that married women were significantly more likely to support Mitt Romney, the Republican presidential candidate, when they were in the fertile portion of their ovulatory cycle: of those women queried during their peak fertility period, 40.4% expressed support for Romney, while only 23.4% of the married women polled at infertile times were pulling the lever for Mitt. The sample is small, just 228 women, but the difference is big, big enough that the result passes the p-value test with a score of .03.
Which is just the problem—the difference is too big. Interpreted as a change within individual voters, it would suggest that nearly half of the married Romney supporters spend a large part of each month supporting Barack Obama. Wouldn’t anyone notice? But comparing different women at different points in their cycles does not itself establish that individual voters switch preferences.
If there is an association, the study may have exaggerated its size. In a small sample, a modest effect can fail the significance threshold while an estimate inflated by noise passes it. Selecting only the passing results therefore favors overestimates. This does not establish that the association is real, or that cycle stage causes a change in political preference.
Sampling noise can also obscure an effect or give an estimate the wrong sign. Statistical significance alone does not tell us whether the reported size and direction will hold up.
Scientists call this problem “the winner’s curse,” and it’s one reason that impressive and loudly touted experimental results often melt into disappointing sludge when the experiments are repeated. In a representative case, a team of scientists led by psychologist Christopher Chabris studied thirteen single-nucleotide polymorphisms (SNPs) in the genome that had been observed in previous studies to have statistically significant correlations with IQ scores. We know that the ability to do well on IQ-type tests is somewhat heritable, so it’s not unreasonable to look for genetic markers. But when Chabris’s team tested those SNPs against IQ measures in large data sets, like the ten-thousand-person Wisconsin Longitudinal Study, every single one of these associations vanished into insignificance; if they’re real at all, they’re almost certainly too small for even a big trial to detect. The genomic research described here suggested that heritability of IQ scores is probably not concentrated in a few smarty-pants genes, but rather accumulates from numerous genetic features, each one having a tiny effect. Which means that if you go hunting for large effects of individual polymorphisms, you’ll succeed—at the same 1-in-20 rate as do the entrail readers.
John Ioannidis’s criticism of published research does not imply that only one in a thousand papers is correct. Most studies do not consist of blundering around the genome at random. They test hypotheses the researchers have some prior reason to consider plausible, which affects how a significant result should be interpreted. But the crisis of replicability is real. In a 2012 study, scientists at the California biotech company Amgen set out to replicate some of the most famous experimental results in the biology of cancer, fifty-three studies in all. In their independent trials, they were able to reproduce only six.
How can this have happened? It’s not because genomicists and cancer researchers are dopes. In part, the replicability crisis is simply a reflection of the fact that science is hard and that most ideas we have are wrong—even most of those ideas that survive a first round of prodding.
But there are practices in the world of science that make the crisis worse, and those can be changed. For one thing, we’re doing publishing wrong. Consider the profound xkcd cartoon below. Suppose you tested twenty genetic markers to see whether they were associated with some disorder of interest, and you found just one result that achieved p < .05 significance. Being a mathematical sophisticate, you’d recognize that one success in twenty is exactly what you’d expect if none of the markers had any effect, and you’d scoff at the misguided headline, just as the cartoonist intends you to.
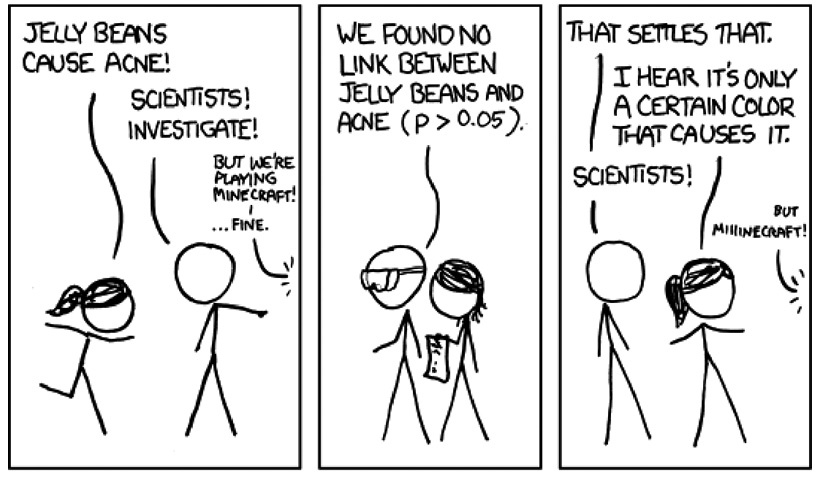
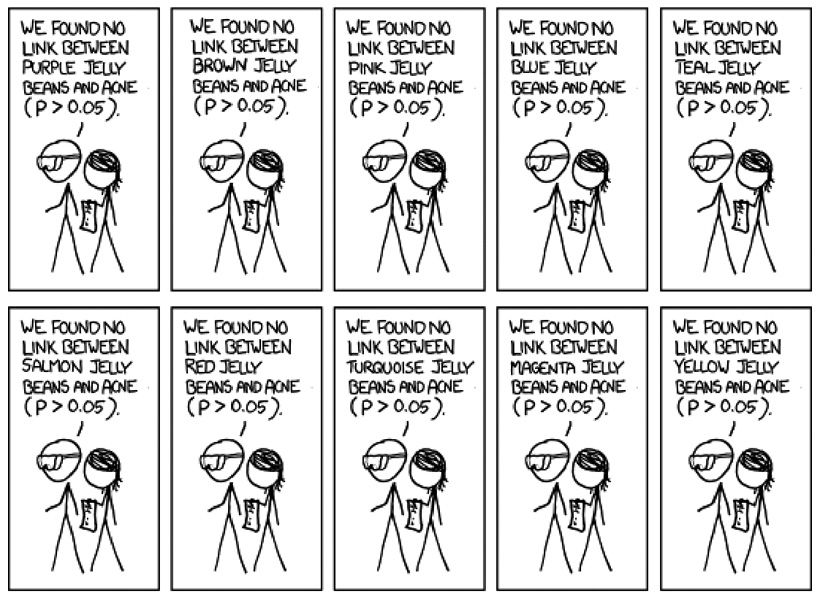
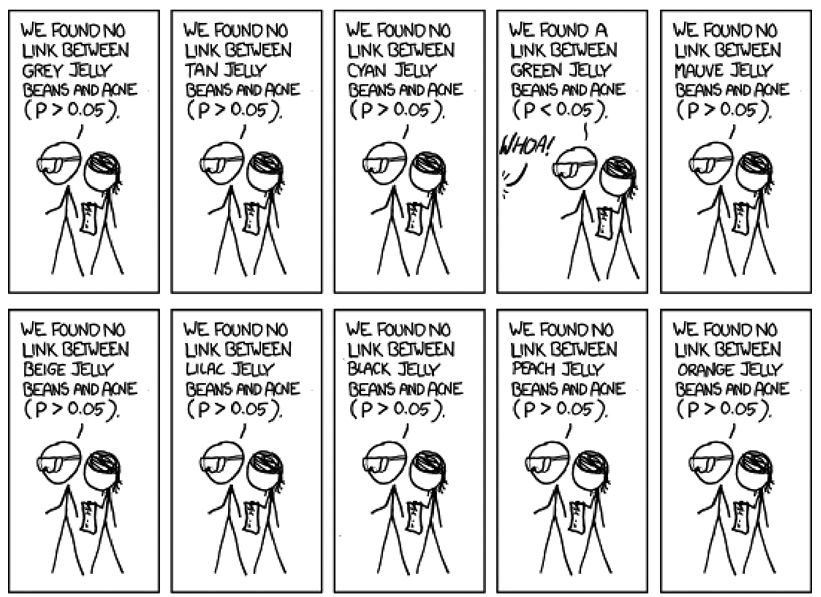
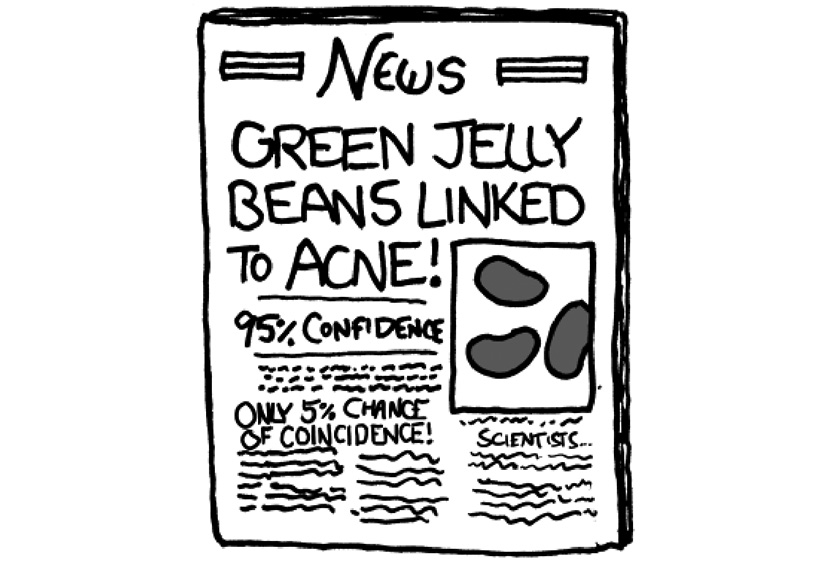
All the more so if you tested the same gene, or the green jelly bean, twenty times and got a statistically significant effect just once.
But what if the green jelly bean were tested twenty times by twenty different research groups in twenty different labs? Nineteen of the labs find no statistically significant effect. They don’t write up their results—who’s going to publish the bombshell “green jelly beans irrelevant to your complexion” paper? The scientists in the twentieth lab, the lucky ones, find a statistically significant effect, because they got lucky—but they don’t know they got lucky. For all they can tell, their green-jellybeans-cause-acne theory has been tested only once, and it passed.
If you decide what color jelly beans to eat based just on the papers that get published, you’re making the same mistake the army made when they counted the bullet holes on the planes that came back from Germany. As Abraham Wald pointed out, if you want an honest view of what’s going on, you also have to consider the planes that didn’t come back.
This is the so-called file drawer problem—a scientific field has a drastically distorted view of the evidence for a hypothesis when public dissemination is cut off by a statistical significance threshold. It resembles the Baltimore stockbroker scheme: send conflicting predictions to different prospective clients, then approach only those who happened to receive a winning sequence. The lucky scientist excitedly preparing a press release about dermatological correlates of Green Dye #16 is just like the naive investor mailing off his life savings to the crooked broker. The investor, like the scientist, gets to see the one rendition of the experiment that went well by chance, but is blind to the much larger group of experiments that failed.
There’s one big difference, though. In science, there’s no shady con man and no innocent victim. When the scientific community file-drawers its failed experiments, it plays both parts at once. They’re running the con on themselves.
And all this is assuming that the scientists in question are playing fair. But that doesn’t always happen. Consider the analytical wiggle room that can make a search for hidden messages seem convincing. Scientists, subject to the intense pressure to publish lest they perish, are not immune to the same wiggly temptations. If you run your analysis and get a p-value of .06, you’re supposed to conclude that your results are statistically insignificant. But it takes a lot of mental strength to stuff years of work in the file drawer. After all, don’t the numbers for that one experimental subject look a little screwy? Probably an outlier, maybe try deleting that line of the spreadsheet. Did we control for age? Did we control for the weather outside? Did we control for age and the weather outside? Give yourself license to tweak and shade the statistical tests you carry out on your results, and you can often get that .06 down to a .04. Uri Simonsohn, a professor at Penn who’s a leader in the study of replicability, calls these practices “p-hacking.” Hacking the p isn’t usually as crude as I’ve made it out to be, and it’s seldom malicious. The p-hackers truly believe in their hypotheses, just as the Bible coders do, and when you’re a believer, it’s easy to come up with reasons that the analysis that gives a publishable p-value is the one you should have done in the first place.
But everybody knows it’s not really right. When they don’t think anyone’s listening, scientists call this practice “torturing the data until it confesses.” And the reliability of the results is about what you’d expect from confessions extracted by force.
Assessing the scale of the p-hacking problem is not so easy—you can’t examine the papers that are hidden in the file drawer or were simply never written, just as you can’t examine the downed planes in Germany to see where they were hit. But you can, like Abraham Wald, make some inferences about data you can’t measure directly.
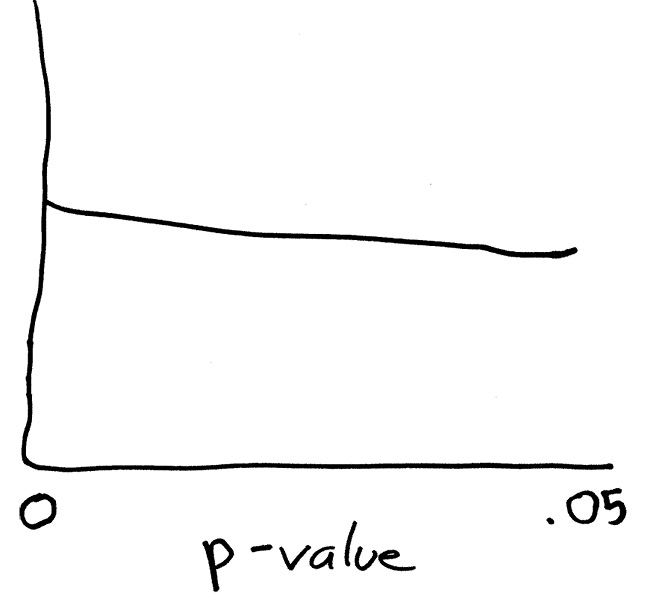
Think again about International Journal of Haruspicy. What would you see if you looked at every paper ever published there and recorded the p-values you found? In this imaginary journal, the null hypothesis is always true because haruspicy doesn’t work. With an idealized, correctly calibrated continuous test, 5% of experiments will record a p-value of .05 or below; 4% will score .04 or below; 3% will score .03 or below, and so on. Another way to say this is that the number of experiments yielding a p-value between .04 and .05 should be about the same as the number scoring between .03 and .04, between .02 and .03, and so on. If you plotted all the p-values reported in all the papers you’d see a flat graph like this:
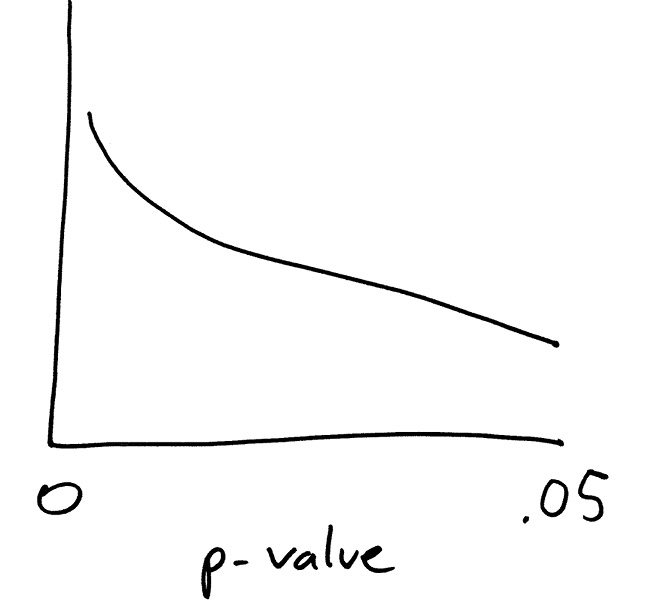
Now what if you looked at a real journal? Hopefully, a lot of the phenomena you’re hunting for are actually real, which makes it more likely that your experiments will get a good (which means low) p-value score. So the graph of the p-values ought to slope downward:
Except that’s not exactly what happens in real life. In fields ranging from political science to economics to psychology to sociology, statistical detectives have found a noticeable upward slope as the p-value approaches the .05 threshold:
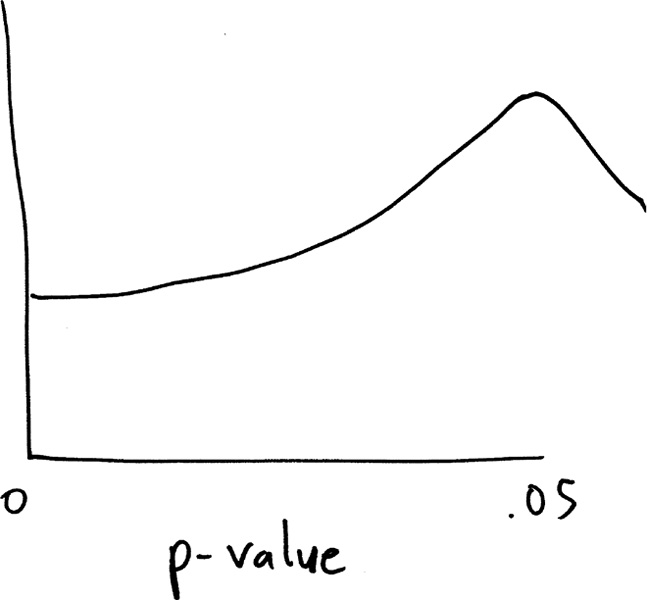
Such a pattern can be evidence of selective reporting or p-hacking around the p= .05 boundary. It suggests that some results have been cajoled, prodded, tweaked, or just plain tortured onto the publishable side. The pattern alone does not establish how any particular study was analyzed. That’s good for the scientists who need publications, but it’s bad for science.
What if an author refuses to torture the data, or the torture fails to deliver the desired result, and the p-value stays stuck just above the all-important .05? There are workarounds. Scientists will twist themselves into elaborate verbal knots trying to justify reporting a result that doesn’t make it to statistical significance: they say the result is “almost statistically significant,” or “leaning toward significance,” or “well-nigh significant,” or “at the brink of significance,” or even, tantalizingly, that it “hovers on the brink of significance.” It’s easy to make fun of the anguished researchers who resort to such phrases, but we should be hating on the game, not the players—it’s not their fault that publication is conditioned on an all-or-nothing threshold. To live or die by the .05 is to make a basic category error, treating a continuous variable (how much evidence do we have that the drug works, the gene predicts IQ, fertile women like Republicans?) as if it were a binary one (true or false? yes or no?). Scientists should be allowed to report statistically insignificant data.
In some settings, they may even be compelled to. In a 2010 opinion, the U.S. Supreme Court ruled unanimously that Matrixx, the maker of the cold remedy Zicam, was required to reveal that some users of its product had suffered anosmia, a loss of the sense of smell. The court’s opinion, written by Sonia Sotomayor, held that even though the reports of anosmia didn’t pass the significance test, they still contributed to the “total mix” of information investors in a company can reasonably expect to have available. A result with a weak p-value may provide only a little evidence, but a little is better than none; a result with a strong p-value might provide more evidence, but as we’ve seen, it’s far from a certification that the claimed effect is real.
There is nothing special, after all, about the value .05. It’s purely arbitrary, a convention chosen by Fisher. There’s value in convention; a single threshold, agreed on by all, ensures that we know what we’re talking about when we say the word “significant.” I once read a paper by Robert Rector and Kirk Johnson of the conservative Heritage Foundation complaining that a rival team of scientists had falsely claimed that abstinence pledges made no difference in teen rates of sexually transmitted diseases. In fact, the teens in the study who’d pledged to wait for their wedding night did have a slightly lower rate of STDs than the rest of the sample, but the difference wasn’t statistically significant. The Heritagists had a point; the evidence that pledges worked was weak, but not entirely absent.
On the other hand, Rector and Johnson write in another paper, concerning a statistically insignificant relationship between race and poverty that they wish to dismiss, “If a variable is not statistically significant, it means that the variable has no statistically discernable difference between the coefficient value and zero, so there is no effect.” What’s good for the abstinent goose is good for the racially charged gander! The value of convention is that it enforces some discipline on researchers, guarding them from the temptation to let their own preferences determine which results count and which don’t.
But a conventional boundary, obeyed long enough, can be easily mistaken for an actual thing in the world. Imagine if we talked about the state of the economy this way! Economists have a formal definition of a “recession,” which depends on arbitrary thresholds just as “statistical significance” does. One doesn’t say, “I don’t care about the unemployment rate, or housing starts, or the aggregate burden of student loans, or the federal deficit; if it’s not a recession, we’re not going to talk about it.” One would be nuts to say so. The critics—and there are more of them, and they are louder, each year—say that a great deal of scientific practice is nuts in just this way.
When to use it
When reading news about a new medical breakthrough, consider whether the result could be a winner's curse effect due to small sample size and selective reporting.
In evaluating candidate genes for a trait, be aware that initial significant findings may not replicate in larger, more rigorous studies.
When conducting your own research, pre-register your analysis plan to reduce p-hacking and increase credibility.
In policy-making, avoid relying solely on statistically significant results; consider the total mix of evidence, including non-significant findings.
FROM THEORY TO EVERYDAY LIFE
In practice
Ovulation and Political Preferences
In a study with 228 women, the reported comparison among married participants was 40.4% support for Romney during peak fertility versus 23.4% at other times, with p = .03. Ellenberg uses the large estimate to illustrate how selection for significance can favor effects exaggerated by noise; the comparison does not establish individual voters changing preferences.
SNPs and IQ
Chabris and colleagues examined 13 genetic markers previously reported to correlate with IQ. They did not confirm those associations in larger data sets, including the Wisconsin Longitudinal Study. This illustrates the need to check initial significant findings in independent samples.
Amgen Replication of Cancer Studies
Amgen researchers attempted to replicate 53 selected cancer-biology findings and reported reproducing only 6. That result raises concerns about those findings; it is not an estimate of the replication rate of all cancer research.
A MOMENT TO REFLECT
Put it to work.
How might the winner's curse affect your interpretation of a single study with a p-value just below 0.05?
What steps can researchers take to avoid p-hacking and ensure their results are trustworthy?
Why is it important to consider unpublished studies (the file drawer) when evaluating a scientific claim?
Often confused with
CONTINUE THE CONVERSATION
Source texts
- How Not to Be Wrong The Power of Mathematical Thinking (Ellenberg, Jordan)