The Probability Tree
A probability tree adds likelihoods to a scenario tree, showing possible outcomes and how likely each is. Sensitivity analysis then helps identify key decisions and events.
THE IDEA
The Probability Tree
A probability tree has all the attributes of a scenario tree plus one: It enables us to analyze the entire tree and any of its elements from the perspective of probability. It further enables us to estimate which scenario is most likely and which is least likely, and which decisions and events within the alternative scenarios are most likely and least likely. Whereas a scenario tree shows only what can and cannot happen, a probability tree shows what is likely and unlikely to happen. Adding probability as a dimension to our analysis therefore instills reality in our findings.
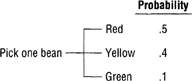
FIGURE 13-2 Probability Tree
A probability tree, moreover, highlights and allows us to focus our attention on, collect evidence on, challenge the assumptions on, those decisions and events that determine the viability of scenarios that are important to us. We can enhance our ability to identify these determinants by arbitrarily varying the probabilities we assign them—doing what is called sensitivity analysis. A probability tree can therefore show us on which decision or event we should concentrate our effort if we wish to increase the likelihood of a particular scenario. Imagine the immense value and power of knowing where to concentrate one’s effort to bring about an outcome we favor.
There are three inviolable rules for constructing probability trees:
- As with any scenario tree, the events depicted must be mutually exclusive, meaning each event is distinct from the others.
- Likewise, the events must be collectively exhaustive, meaning they must include all possible events in the scenario being analyzed.
- The probabilities of the branches at each node (each branching of the tree) must equal 1.0.
A point to remember for those unaccustomed to dealing with, and calculating, numerical probabilities is that an event cannot occur more times than its possibility of occurring. Therefore, probability can never be greater than 100 percent, or 1.0.
Let’s raise the complexity of the jelly bean problem a notch.
What is the probability of picking a red or a green jelly bean from the jar in one try?
Again, the way to solve this problem is to think in terms of percentages: what percent of the beans in the jar are red or green? There are 45 red and 9 green, which equals 54. What percent of 90 is 54? IS (54) over OF (90) = .6. So we have a .6 probability of picking red or green on one try. What we did, in effect, was to add the probability of picking a red (.5) and the probability of picking a green (.1).
When to use it
Business risk assessment: Map possible market reactions and internal decisions to estimate the likelihood of project success.
Scientific hypothesis testing: Model experimental outcomes and their probabilities to guide data collection.
Personal finance: Evaluate investment choices under different economic scenarios to determine the most robust strategy.
Project management: Analyze decision points and uncertain events to identify the most probable paths and allocate resources efficiently.
FROM THEORY TO EVERYDAY LIFE
In practice
Jelly Bean Probability – Red or Green
From a jar of 90 jelly beans (45 red, 9 green, and the rest other colors), the probability of picking a red or green in one try is calculated by adding their probabilities: 0.5 + 0.1 = 0.6. A probability tree combines these mutually exclusive events by adding their probabilities.
Investment Decision Sensitivity
A probability tree can model an investment decision with branches for market growth (bull/bear) and company performance (positive/negative). By varying probabilities, sensitivity analysis reveals which factor most influences the desired outcome, guiding where to focus research.
A MOMENT TO REFLECT
Put it to work.
Think of a recent decision you made. How would building a probability tree have changed your evaluation of the outcomes?
What events in your personal or professional life could be better understood by assigning probabilities to branches in a scenario tree?
How can sensitivity analysis on a probability tree help you challenge assumptions about which factors are most critical to success?
Often confused with
CONTINUE THE CONVERSATION
Source texts
- The Thinkers Toolkit by Morgan D Jones