The Gaussian and the Mandelbrotian
Contrasts the Gaussian (bell curve) distribution, which underestimates extreme events, with the Mandelbrotian (fat-tailed) distribution, which better captures rare but impactful occurrences, using the example of German hyperinflation.
THE IDEA
THE GAUSSIAN AND THE MANDELBROTIAN
I was transiting through the Frankfurt airport in December 2001, on my way from Oslo to Zurich.
I had time to kill at the airport and it was a great opportunity for me to buy dark European chocolate, especially since I have managed to successfully convince myself that airport calories don’t count. The cashier handed me, among other things, a ten deutschmark bill, an (illegal) scan of which can be seen on the next page. The deutschmark banknotes were going to be put out of circulation in a matter of days, since Europe was switching to the euro. I kept it as a valedictory. Before the arrival of the euro, Europe had plenty of national currencies, which was good for printers, money changers, and of course currency traders like this (more or less) humble author. As I was eating my dark European chocolate and wistfully looking at the bill, I almost choked. I suddenly noticed, for the first time, that there was something curious about it. The bill bore the portrait of Carl Friedrich Gauss and a picture of his Gaussian bell curve.
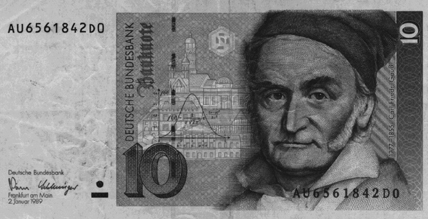
The last ten deutschmark bill, representing Gauss and, to his right, the bell curve of Mediocristan.
The striking irony here is that the last possible object that can be linked to the German currency is precisely such a curve: the reichsmark (as the currency was previously called) went from four per dollar to four trillion per dollar in the space of a few years during the 1920s, an outcome that tells you that the bell curve is meaningless as a description of the randomness in currency fluctuations. All you need to reject the bell curve is for such a movement to occur once, and only once—just consider the consequences. Yet there was the bell curve, and next to it Herr Professor Doktor Gauss, unprepossessing, a little stern, certainly not someone I’d want to spend time with lounging on a terrace, drinking pastis, and holding a conversation without a subject.
Shockingly, the bell curve is used as a risk-measurement tool by those regulators and central bankers who wear dark suits and talk in a boring way about currencies.
When to use it
Risk management: modeling tail risks in market crashes beyond normal distribution assumptions.
Insurance pricing: assessing probability of catastrophic claims (e.g., natural disasters) using fat-tailed distributions.
Economic modeling: analyzing income inequality (Pareto vs. Gaussian) to understand wealth concentration.
Engineering safety: designing systems for rare but extreme stresses like earthquakes or cyber attacks.
FROM THEORY TO EVERYDAY LIFE
In practice
German Hyperinflation and the Banknote
The ten deutschmark bill featured Gauss and the bell curve, yet the German currency experienced hyperinflation from 4 marks per dollar to 4 trillion marks per dollar in the 1920s—an extreme event that the bell curve cannot predict. A Gaussian model of currency fluctuations drastically underestimates this risk.
A MOMENT TO REFLECT
Put it to work.
How might over-reliance on the bell curve lead to poor decision-making in fields like finance or insurance?
Can you recall a personal or historical event that seemed unimaginable but had massive impact? How does the Mandelbrotian view explain it?
Why do you think the bell curve remains popular despite its failure to account for rare events?
CONTINUE THE CONVERSATION
Source texts
- The Black Swan The Impact of the Highly Improbable With a new section On Robustness and Fragility (Nassim Nicholas Taleb)