Seeing the Global Climate Change System
A systems thinking model for understanding global climate change, emphasizing the feedback loops and delays between CO2 emissions, atmospheric concentration, and temperature, and the need to see beyond immediate economic activity.
THE IDEA
SEEING THE GLOBAL CLIMATE CHANGE SYSTEM
Senge’s historical account focuses on emissions as a flow and atmospheric concentration as a stock. The policy discussion and numerical comparisons refer to that period.
Seeing global systems in ways that mobilize change may seem more difficult, but I believe the basic principles are not fundamentally different. Following is a simple systems diagram to help people see the system influencing global climate change.3 As with the beer game, our first need is to expand our personal boundaries of awareness beyond just managing our own position. In this case, the traditional focus of business and of society has been on economic activity, and its growth through reinforcing processes involving income, demand, and capital investment. What we have not seen, until very recently, is one of the physical by-products of economic growth: greenhouse gases like CO 2 released into the atmosphere.
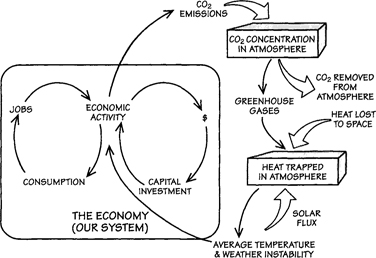
These emissions flow into a stock of CO 2 in the atmosphere (CO 2 concentration), just like the orders placed in the beer game flow into the supplier’s backlog.4 As the stock of CO 2 in the atmosphere rises, more heat is trapped in the atmosphere. The resulting temperature increases have largely unknown effects on natural systems and ultimately on economic activity. Some claim that warmer climates will be good for business and economic growth. But many question these optimistic scenarios, and the simple truth is that immense uncertainties lie ahead—including weather instability, the spread of tropical diseases, the effects of added freshwater in the oceans from melting glaciers and polar ice, and shifting ocean currents.
In recent years, people around the world have begun to see this system, but they have sharply divided views about the implications for the next few decades and consequently the urgency of curtailing CO 2 emissions. Enough countries eventually approved the 1994 Kyoto Protocol, designed to curtail greenhouse gas emissions, that it finally went into effect in 2003. But the two largest producers of CO 2 emissions, the United States (approximately 25 percent of global emissions) and China (approximately 11 percent), refused to join. A small but growing number of global corporate leaders believe even more aggressive actions are needed, including BP’s John Browne, who first broke ranks with other oil company CEOs in 1997, speaking out about the dangers of climate change in a historic speech at Stanford University.5 Still, for many citizens of the world, climate change remains a disquieting but distant concern. As an American friend said to me recently, “Well, it will probably be a problem for people in a hundred years or so.”
These sharply diverging views are a tragic testimony to our inability to apply even the most rudimentary systems thinking to look at the facts we have today in ways that allow us to see their implications for the future. The following graphs show historical data from the last one hundred and fifty years that correspond to the parts of the systems diagram, CO 2 emissions and average temperature, at the periphery of our mental models.6 The lower curve shows a slight rise—a bit less than 1 degree—in average annual temperature, not likely to invoke great concern, especially given the many short-term fluctuations. But patterns in the top two curves are much less ambiguous: CO 2 concentration in the atmosphere has increased about 30 percent over the last one hundred and fifty years (middle graph) and CO 2 emissions from combustion of fossil fuels (top graph) has grown dramatically from virtually zero.7
I first showed these graphs at a major business conference on sustainable development in Europe in 2004. The five hundred or so attendees were knowledgeable and involved in a host of sustainability initiatives, including climate change. Eager to gauge their ability to interpret these curves systemically, I asked, “How would an 8-year-old child make sense of this situation and what would they want to know?” I suggested to the group that they start by thinking of a bathtub and the water flowing into the bathtub. People quickly saw that CO 2 emissions are like the water flowing into the tub and CO 2 concentration is like the current water level. When I asked what other information the child would want to know, several realized that the future also depended on the size of the outflow, the rate at which CO 2 is coming out of the atmosphere. Having realized that this missing piece of data was important to know, I asked how many people knew what the level of this outflow, “carbon sequestration,” was in relation to the level of the inflow of emissions. I was shocked to find only about ten hands raised. At that moment I understood why we were in trouble. Only a few people in a group of this caliber knew that CO 2 is coming out of the atmosphere at far less than one-half the rate at which it is going in8 — Figure unavailable in the source files.
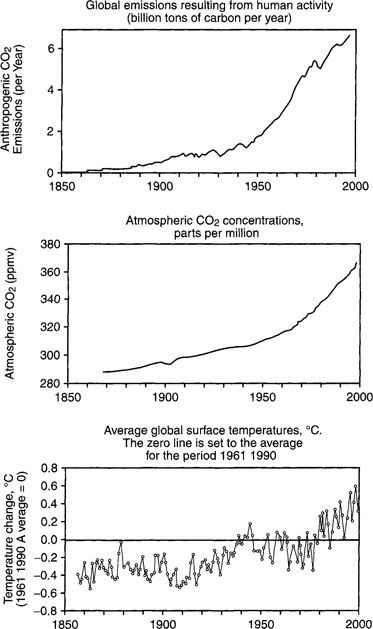
Gradually the significance of this figure dawned on the group. Even if every country in the world met the targets of the Kyoto Protocol tomorrow (stabilizing global emissions at 1990 levels), CO 2 concentration would keep rising as long as emissions exceeded removal. A 50 percent,9 or greater, reduction in CO 2 emissions worldwide appeared beyond even the most aggressive plans Senge was discussing.10
No one knows how the global climate system will react to a continuing dramatic increase in CO 2 concentration. More importantly, no one knows what we as denizens of Earth will choose to do to reduce emissions. As the ancient Chinese adage goes, “If we keep heading as we are, we are likely to get where we are going.” And we do know that the “we” will be our children and grandchildren. Despite all the uncertainties, it is safe to say that we have not yet seen the real effects of climate change, but the next generations will—unless we can learn to see the system we are creating and head in a different direction.
When to use it
Policymakers using systems diagrams to communicate the urgency of emission reductions.
Business leaders applying feedback loop thinking to sustainability strategies.
Educators teaching climate change with the bathtub analogy to highlight stock-and-flow dynamics.
Environmental activists using the system model to challenge short-term thinking.
FROM THEORY TO EVERYDAY LIFE
In practice
Bathtub Analogy
Carbon dioxide emissions are like water flowing into a bathtub, and atmospheric concentration is like the water level. Stabilizing the inflow does not stabilize the level if water is still entering faster than it leaves. The concentration stops rising only when additions and removals balance.
Business Conference Exercise (2004)
In Senge’s account of a European sustainability conference, about 10 out of 500 attendees knew the comparison he gave between carbon removal and emissions. He uses their response to show how a group can know about climate change yet overlook the distinction between a stock and a flow.
A MOMENT TO REFLECT
Put it to work.
How does the bathtub analogy help you understand the difference between stabilizing emissions and stabilizing atmospheric concentration?
Why might a focus on immediate economic activity blind people to the long-term effects of CO2 emissions?
What other global systems might suffer from similar delays between cause and effect?
References
- Speech at Stanford University on climate change dangers — John Browne (BP CEO) (1997)
- Kyoto Protocol — United Nations (1994)
CONTINUE THE CONVERSATION
Source texts
- The Fifth Discipline The Art Practice of the Learning Organization (Peter M. Senge)