Reflexivity and the Sexual Market Place
Reflexivity occurs when perceptions affect behavior and the resulting behavior reinforces those perceptions. Applied to dating, the idea suggests that visible interest can attract further interest. It does not establish an objective sexual market value or the universal rating and age patterns assumed in this account.
THE IDEA
Reflexivity and the Sexual Market Place
Reflexivity describes feedback between perceptions and the conditions people respond to. In a financial market, rising prices may attract buyers whose purchases raise prices further. Selling can likewise reinforce a decline. A feedback loop need not continue indefinitely or reverse in a predictable way. (26)
Applied to dating, the idea is illustrated by the saying "You never get more females hitting on you than when you are already in a relationship". Interest from others may act as social proof and draw further attention. The saying is an illustration, not evidence of a universal response.
The account calls perceived desirability sexual market value (SMV). It then assumes sex-specific patterns of rising and falling value, including a fixed age curve for women. Those patterns are not established by the feedback mechanism itself, and the article supplies no measurements that would make SMV an objective scale.
Social media and dating platforms offer possible settings for feedback: attention may increase visibility, which may attract more attention. But this possibility does not show that women’s value is generally inflated or that men’s value is generally depressed. Platform participation, individual preferences and how people encounter one another would all matter to such an explanation.
Assumptions Behind the Rating Model
The proposed model places an average woman at five on a scale from 1 - 10, assumes online attention raises her self-rating to 7 - 9, and assumes she therefore seeks a partner rated 8 - 10. These are inputs to the argument, not findings demonstrated here.
It then predicts increased attention for men rated 8 - 10 and a mismatch between the partners people seek and those available. That prediction depends on accepting the ratings and preference rules first. It cannot independently validate them.
The account also suggests that social proof, dominance and independence from an outcome increase male desirability. These are proposed influences, not a complete or universal description of attraction.
Calling the upper tail a "sweet spot" requires an additional assumption: that SMV follows a normal distribution. The comparison with IQ scores in the range 85 - 115 does not establish that dating preferences have the same distribution. Data clustering around a mean is not, by itself, enough to show normality.
The account next assumes women seek men 1 - 3 rating points above themselves and calls eight the "perfect" male rating, because it supposedly appeals to women rated five, six and seven. Neither the preference rule nor the conclusion is demonstrated. Its further claim that most marriages occur at ages 27 - 29 is presented without supporting data here.
The model asks whether online interaction changes perceived distributions. That is a question about a specified population and platform; it would require defined measures and observations to answer.
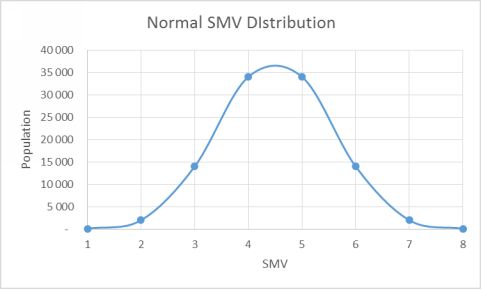
Graph 10 Standard Bell Curve
The bell curve illustrates the assumed distribution. It does not establish that people can be assigned equivalent, objective values or that a matched rating predicts a relationship’s quality.
The account assumes women peak between 20 and 25 and men between 35 and 40. From that, it predicts that partners matched at 29 will diverge in value. It illustrates this with partners initially rated SMV 6, then argues that a woman at 29 should choose a lower-rated man to preserve an equitable match over time. The recommendation depends on the unverified age curves and treats a relationship as though it could be reduced to this rating. Its prediction about later infidelity does not follow from reflexivity alone.
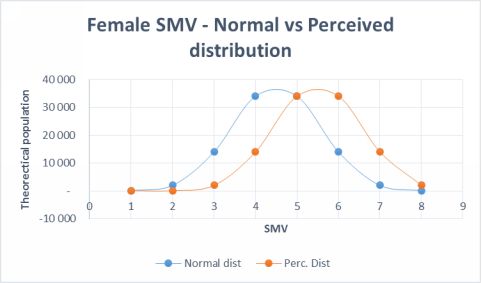
Graph 11 Female SMV distribution Real vs Perceived
This diagram represents a proposed upward shift in perceived female ratings. On its scale from 1 - 8, the account places the new average at five and six rather than four and five. The diagram illustrates an assumption; it does not provide evidence for the shift or for an objective baseline.
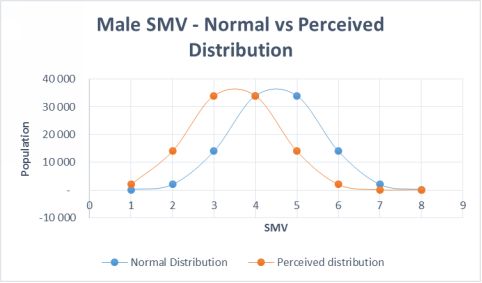
Graph 12 Male SMV real vs perceived
The corresponding male diagram places the mean at 3 and 4. Again, the shift is asserted rather than measured in the material presented.
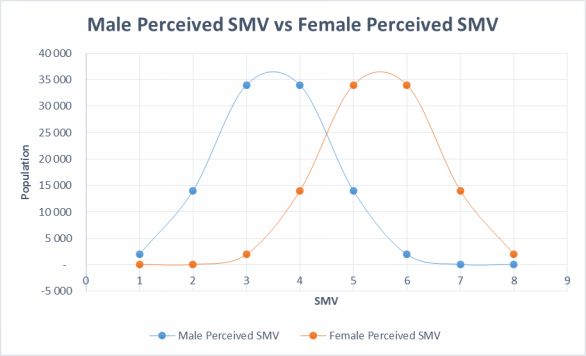
Graph 13 Male vs Female Perceived SMV
The account concludes that 80% of women pursue 20% of men, then predicts further gains in attention for men rated 6 and above. Those percentages and the threshold do not follow merely from drawing shifted curves. They require evidence about actual preferences and interactions.
The useful question is narrower: when does visible attention change subsequent attention, and how much? Reflexivity offers a possible feedback mechanism to investigate. It does not establish the article’s ratings, distributions or universal claims about either sex.
When to use it
Examining whether visible interest in a person influences subsequent attention in a particular social setting.
Testing whether platform feedback changes expectations about dating, while distinguishing measured behavior from assumed ratings.
Considering feedback in career or social settings where perceived success may create further opportunities.
Reflecting on how profile visibility and platform design may shape your experience of online dating.
FROM THEORY TO EVERYDAY LIFE
In practice
Relationship Attention Feedback Loop
The saying 'You never get more females hitting on you than when you are already in a relationship' illustrates a proposed feedback loop: visible interest from one person might attract interest from others. It does not show that this happens to everyone or that the loop must become unsustainable.
Social Media and Perceived Desirability
The account assumes online attention makes women rate themselves at 7-9 and seek partners at 8-10. Those ranges are hypothetical inputs to its model, not measurements supplied by the article.
Uneven Attention on Dating Platforms
If a platform makes already popular profiles more visible, attention could become self-reinforcing. That possibility needs to be distinguished from the account’s unsupported general claim that most men are devalued.
A MOMENT TO REFLECT
Put it to work.
Have social media or dating apps changed what you notice or expect in relationships? What evidence suggests a feedback loop rather than another explanation?
Have you noticed attention changing when someone appears to be in a relationship? What other factors could explain the difference?
Which qualities matter to you in a long-term partnership, and which would be lost by reducing the decision to a single desirability rating?
CONTINUE THE CONVERSATION
Source texts
- Rolf Dobelli - The Art of Thinking Clearly-Harper Paperbacks (2014)