Predictive Use of Heuristics in Risk Estimation
This advanced text explores how heuristics, particularly availability, are used to estimate risks such as causes of death, emphasizing the need to understand psychological and contextual factors to predict heuristic use, accuracy, and debiasing processes.
THE IDEA
Prediction
The predictive use of heuristics requires an understanding of both psychology and circumstances. One must answer the following questions:
• Will heuristic thinking arise?
• Which heuristics will be invoked?
• How will they be interpreted?
• How accurate will the resulting judgments be?
• What debiasing processes will arise?
• How will those processes affect the judgments and individuals’ confidence in them?
Possible Processes in Risk Estimation. One broad domain that invites heuristic thinking is estimating risks to health, safety, and the environment. Sexual assault is typical: People rarely get quantitative risk estimates. If they do, they still must integrate population values with the specifics of personal situations. Moreover, expert estimates are themselves but judgments – going beyond the realm of solid observation and robust theory. As a result, people must decide how far to trust the experts’ beliefs, as well as their own.
Given the great variety of risks that people might consider, relying on general-purpose heuristics seems plausible. Some form of availability seems like a particularly reasonable choice: How often has one seen or heard about the risk occurring? How readily can one imagine it? If people follow this strategy, they should assign higher probabilities to events that they see or hear about more often. The accuracy of these estimates should depend on how well three conditions are met: (1) the exposures are proportional to actual frequencies; (2) the events are equally memorable; and (3) people have reliable mental mechanisms for converting the availability of instances into summary estimates. Predicting availability-based risk estimates requires predicting these component processes, as well as the impact of any attempted debiasing procedures (e.g., seeking multiple sources, discounting media sensationalism).
Such judgments should go astray in several predictable ways. Some causes of death are seldom, if ever, reported (e.g., suicide, in societies where it is proscribed; cancer, where it is not discussed; AIDS, where individuals hope to hide their route of exposure; smoking, where deaths are attributed to immediate causes, such as emphysema). Other deaths are routinely reported close to where they occur (e.g., fires, homicides, single-fatality auto accidents), around the country (e.g., tornadoes, multi-fatality auto accidents), or around the world (e.g., hate crimes, terror acts, earthquakes). Word of mouth creates other differential exposures. Whispers may fill in the blanks of some unreported events, reiterate some reported ones, and even invent some fictitious ones. Direct experience creates its own patterns of exposure to causes of death. These may depend on age (e.g., how many older people does one know?), culture (e.g., how isolated are different ages and classes?), and socioeconomic status (e.g., how well is violence hidden? how are deaths from lingering illnesses explained?).
Generating availability-based predictions requires understanding these exposure patterns. These are topics in anthropology, sociology, and communications research. They have methods, and perhaps even results, for estimating particular exposures. These include counting mentions of a topic in the news media and observing what people see (and notice) of what is mentioned (Combs & Slovic, 1979; Singer & Endreny, 1994; Slater, 1996; Tyler, 1990). A more psychological approach to measuring exposures is asking people what they remember having seen or heard (e.g., “Tell me about everyone you know who was murdered, killed in an auto accident.”). These reports need not be taken as veridical, but could be interpreted in the light of research into the vagaries of time (e.g., telescoping), introspection, and encoding processes (e.g., Ericsson & Simon, 1994; Hasher & Zacks, 1984; Hintzman, 1976; Nisbett & Wilson, 1977).
Some Lay Estimates. Figure 41.1 shows a result of applying this perspective to predicting lay estimates of the annual frequency of 41 causes of death in the United States, as compared to public health statistics. It represents one of the first applications of heuristics-and-biases research to public policy. It has been widely cited in the debate over the public’s competence to participate in decision-making regarding modern technologies. Although any hard evidence should be better than anecdote and rhetoric, the study has often been invoked to support preconceived notions. In particular, it has been cited as demonstrating lay ignorance, even irrationality, regarding risks. I have heard it used to “prove” that citizens are hopelessly confused about nuclear power, which was not even in the stimulus set (and whose average-year fatality rate was judged to be quite low in a related study; Slovic, Fischhoff, & Lichtenstein, 1980). Such strong claims could hardly be demonstrated authoritatively with any single study. As with sexual assault advice, they reflect on the claimants as well as the evidence.
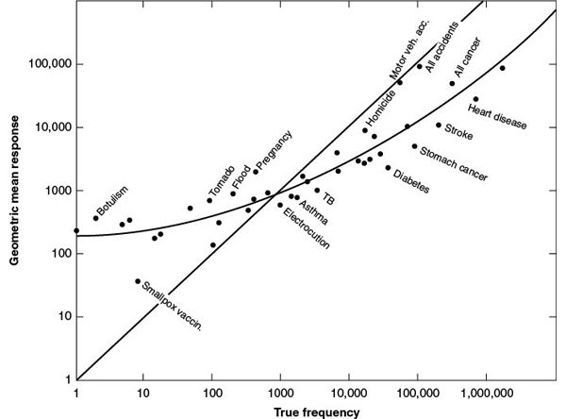
Figure 41.1. Geometric means (GM) of ratio judgments by motor vehicle accident group subjects as a function of true frequency (TF). (Curved line is best-fitting quadratic: log GM = .07 [log TF]2 + .03 log TF + 2.27.) Source: Lichtenstein et al., (1978).
The two most salient patterns in the figure are consistent with availability (and were predicted before we saw the data):
1. The best-fit curve is too flat, relative to the perfect-prediction identity line. That would occur if respondents used the heuristic briefly (as the study required), allowing little opportunity to appreciate fully the differences between very large and very small risks. Such flattening is seen even in experimental studies with stimulus frequencies varying over one order of magnitude, rather than the present five (e.g., Jonides & Naveh-Benjamin, 1987). Brevity could be one source of measurement error producing regressive estimates.
2. The residuals, relative to the best-fit curve, are predictably correlated with several direct and indirect measures of availability. The former included self-reports of having heard of the events causing death or injury. The latter included newspaper mentions of deaths from each cause. Relatively overreported causes (e.g., tornado, floods) were relatively overestimated (Combs & Slovic, 1979); the opposite was true for quieter killers (e.g., diabetes, stroke).
These predictions were for respondents’ relative frequency estimates. Predicting absolute estimates requires additional assumptions regarding how people use quantitative scales. Since the earliest days of psychophysics, researchers have known that subjects seek contextual cues when confronted with unfamiliar response modes (Poulton, 1989; Schwarz, 1999). The terms in this task are, individually, all familiar: “number” of “deaths” in an “average year” in “the United States.” However, their conjunction is unusual – except for risk buffs. Indeed, pretests, providing no context at all (and just the questions), elicited wildly disparate answers. The aggregate death toll for some subjects implied a brutally short life expectancy in the United States; for others, it implied halcyon days of miraculous longevity. Clearly, many subjects had little idea how many people die in a typical year. As a result, we introduced an anchor, noting the 50,000 annual deaths from motor vehicle accidents. As would be expected, estimates stabilized dramatically around the anchor. Because they are reported fairly often, annual motor vehicle deaths might be a relatively fair anchor for this task, already in some people’s minds when predicting real-world risk estimates.
A second experimental condition tested the malleability of these judgments by reporting, instead, that 1,000 persons die annually from electrocution. (At the time, there was no death penalty, so “accidental” went without saying.) Electrocution was chosen because instances seemed proportionately reported and its death toll was a round number, far from the extremes of the range (Poulton, 1968). Reducing the anchor by a factor of 50 (relative to motor vehicle deaths) reduced respondents’ estimates by a factor of 2–5. Having estimates vary by less than a tenth of the variation in anchors indicates the strength of these beliefs. Another sign of robustness was the strong correlation between estimates produced with the two anchors. That ordering was also strongly correlated with one implied by relative frequency judgments for 106 paired causes of death. Thus, despite the novelty of these tasks, subjects revealed consistent beliefs, moderately predicted by availability and anchoring, however the question was asked.
Some Interpretations of Observed Estimates. How satisfactory predictions are depends on the application. For predicting which causes of death most occupy people, an ordering might be adequate (Davies, 1996; Fischer et al., 1991). For predicting which risks people find acceptable, absolute estimates are needed (as are absolute estimates of the associated benefits). Such predictions require delineating the conditions under which real-world estimates are made. Which anchors do people see or generate naturally? Which anchors do others (e.g., advertisers) present, in order to shape judgments? Are risks and benefits viewed in a common framework, reducing the need for absolute estimates (e.g., looking at the cost-effectiveness of different ways to secure a fixed benefit)?
It takes even more delineation to answer the question that prompted this, and much other, research into risk perceptions: Do people know enough to assume a responsible role in managing risks, whether in their lives or in society as a whole? The picture of potential competence that evolved from that research is one of behavioral decision research’s more visible impacts (e.g., Canadian Standards Association, 1997; Fischhoff, 1998; National Research Council, 1989, 1996; Slovic, 1987). The very act of conducting such research makes a political statement: claims regarding public competence need to be disciplined by fact. This is not welcome news to those hoping to create a particular image of the public, reflecting their own prejudices (see Okrent & Pidgeon, 1998). Some partisans would like to depict an immutably incompetent public, in order to justify protective regulations or deference to technocratic experts. Other partisans would like to depict an already competent public, able to fend for itself in an unfettered marketplace and participate in technological decisions.
In Fig. 41.1, the case for the glass being half-full rests on (1) the consistency of estimates elicited with different response modes; (2) the strong correlation (although not absolute correspondence) between lay and statistical estimates; and (3) the correlations between lay fatality estimates and measures of availability. The last of these relationships indicates that people can track what they see, even if they don’t realize how unrepresentative the observed evidence is. The case for the glass being half-empty rests on (1) the enormous range of the statistical frequencies, making some correlation almost inevitable (could people get through life, without knowing that cancer kills more people than botulism?); (2) the malleability of the absolute estimates (which are what people need for making risk–benefit evaluations); and (3) the availability-related biases. The last of these weaknesses might be exploited by those (scaremongers or pacifiers) hoping to manipulate the availability of specific risks.
Choosing Predictive Criteria. These results inform the debate over public competence only to the extent that public responses to risk depend on perceived frequency of death. Subsequent research found, however, that risk has multiple meanings (Slovic, Fischhoff, & Lichtenstein, 1980). When asked to estimate risk (on an open-ended scale with a modulus of 10), lay subjects rank some sources similarly for risk and average year fatalities, but others quite differently. Lay subjects who made this distinction showed sensitivity to the task of Fig. 41.1 (hence, had avoided one of the pitfalls in Table 41.1’s second section). However, a sample of technical experts treated the two definitions of risk as synonymous. A search ensued for additional factors that shape lay definitions of risk.
An early candidate for such a risk factor was catastrophic potential: Other things being equal, people might see greater risk in hazards that can claim many lives at once, as seen perhaps in special concern about plane crashes, nuclear power, and the like. Some experts even proposed raising the number of deaths in each possible accident sequence to an exponent (*>*1), when calculating expected fatalities (Fischhoff, 1984). That idea faded when they realized that, with large accidents, the exponent swamps the rest of the analysis. Moreover, the empirical research suggested that catastrophic potential per se was not a driving factor (Slovic, Lichtenstein, & Fischhoff, 1984). Rather, people worry about the uncertainty surrounding a technology’s risks. It is often great with technologies able to produce catastrophic accidents. If so, then uncertain risk management may have scared audiences more than potential body counts in films like The China Syndrome and A Civil Action.
The correlation between catastrophic potential and uncertainty first emerged in behavioral research predicting risk preferences. Its impetus was Starr’s widely cited (1969) claim that, for a given benefit, the public tolerates greater risk if it is incurred voluntarily (e.g., skiing) than if it is imposed. As evidence, he estimated fatality risks and economic benefits from eight sources. In a plot, he sketched two parallel “acceptable risk” lines, an order of magnitude apart, for voluntary and involuntary risks. Although seminal, the paper was technically quite rough, in terms of sources, estimates, and statistics (Fischhoff et al., 1981). More fundamentally, it assumed that people’s risk and benefit perceptions matched their statistical estimates when determining acceptable trade-offs. The heuristics-and-biases literature made that assumption questionable. A straightforward way to test it was asking citizens to judge technologies in terms of risk, benefits, voluntariness and other potentially relevant risk factors (e.g., catastrophic potential, dread, controllability, scientific uncertainty) (Lowrance, 1976). A first study pursuing that strategy (Fischhoff et al., 1978) found:
1. Little correlation between estimates of current risks and current benefits from the different sources (so that subjects did not see societal institutions as having exacted greater benefit from riskier technologies).
2. No increase in the perceived risk-benefit correlation, after partialing out judgments of the various risk factors (so that subjects did not see society as having set a double standard for voluntary and involuntary technologies – or for any other factor).
3. A belief that the acceptable level of risk for many (but not all) technologies was lower than current levels (contrary to Starr’s hypothesis of a socially determined balance).
4. A significant correlation between judgments of current benefits and acceptable risk levels (indicating a willingness to incur greater risk in return for greater benefit).
5. A large improvement in predicting acceptable risk from perceived benefits, when many risk factors were partialed out, indicating the desire for a double standard (e.g., with higher acceptable levels for voluntarily incurred risks).
This research has helped many institutions to realize that risk entails more than just average-year fatalities when setting their risk-management policies (e.g., Institute of Medicine, 1999; National Research Council, 1996). Predicting public responses to specific technologies requires research like that of the causes-of-death study: looking at how, and how accurately, people perceive the factors determining their judgments of risk (including which heuristics are invoked and where they lead). We (Fischhoff et al., 2001) found that how people perceive a technology on these risk factors predicts its chances of being the target of consumer boycotts or screened by socially responsible investment funds. If so, then the accuracy of those perceptions matters a lot, financially.
When to use it
Public policy makers designing risk communication campaigns to correct misperceptions (e.g., overestimation of rare but dramatic risks).
Risk analysts predicting public reactions to new technologies (e.g., nuclear power, vaccines) by studying perceived risk factors and heuristic use.
Financial advisors anticipating how investors might overestimate the likelihood of market crashes due to recent news coverage.
Health educators creating messages to improve understanding of leading causes of death (e.g., emphasizing the greater risk of heart disease over rare events).
FROM THEORY TO EVERYDAY LIFE
In practice
Sexual Assault Risk Estimation
People rarely get quantitative risk estimates for sexual assault; they must integrate population values with personal situations and decide how far to trust expert judgments. Complex risk estimation leads people to rely on heuristics like availability.
Lay Estimates of Causes of Death
The study by Lichtenstein et al. (1978) asked respondents to estimate the annual number of deaths from 41 causes. Results showed a flattened curve consistent with availability: overreported causes (e.g., tornadoes) were overestimated, while quieter killers (e.g., diabetes) were underestimated. Anchoring also affected absolute estimates, as varying the anchor from 50,000 (motor vehicle deaths) to 1,000 (electrocution) shifted estimates by a factor of 2–5.
A MOMENT TO REFLECT
Put it to work.
Think of a recent news story about a risk (e.g., a disease or accident). How might the availability heuristic influence public perception of that risk? What factors could make that perception inaccurate?
Consider a time you made a risk estimate (e.g., deciding whether to fly or drive). Did you rely on how easily examples came to mind? How could you debias that judgment?
In the debate over public competence in risk management, what evidence from this text supports the view that the public is competent? What evidence challenges it? How do your own views align?
Often confused with
References
- Combs & Slovic — Combs, B., & Slovic, P. (1979)
- Singer & Endreny — Singer, E., & Endreny, P. (1994)
- Slater — Slater, M. D. (1996)
- Tyler — Tyler, T. (1990)
- Ericsson & Simon — Ericsson, K. A., & Simon, H. A. (1994)
- Hasher & Zacks — Hasher, L., & Zacks, R. T. (1984)
- Hintzman — Hintzman, D. L. (1976)
- Nisbett & Wilson — Nisbett, R. E., & Wilson, T. D. (1977)
- Lichtenstein et al. — Lichtenstein, S., Slovic, P., Fischhoff, B., Layman, M., & Combs, B. (1978)
- Jonides & Naveh-Benjamin — Jonides, J., & Naveh-Benjamin, M. (1987)
- Poulton — Poulton, E. C. (1968)
- Schwarz — Schwarz, N. (1999)
- Slovic, Fischhoff, & Lichtenstein — Slovic, P., Fischhoff, B., & Lichtenstein, S. (1980)
- Davies — Davies, P. (1996)
- Fischer et al. — Fischer, G., et al. (1991)
- Canadian Standards Association — Canadian Standards Association (1997)
- Fischhoff — Fischhoff, B. (1984)
- National Research Council — National Research Council (1989)
- Slovic — Slovic, P. (1987)
- Okrent & Pidgeon — Okrent, D., & Pidgeon, N. (1998)
- Slovic, Lichtenstein, & Fischhoff — Slovic, P., Lichtenstein, S., & Fischhoff, B. (1984)
- Starr — Starr, C. (1969)
- Fischhoff et al. — Fischhoff, B., Slovic, P., Lichtenstein, S., Read, S., & Combs, B. (1978)
- Lowrance — Lowrance, W. W. (1976)
- Institute of Medicine — Institute of Medicine (1999)
CONTINUE THE CONVERSATION
Source texts
- Heuristics and Biases The Psychology of Intuitive Judgment (Thomas Gilovich, Dale Griffin, Daniel Kahneman)