Percentages of Net Changes
A share of a net change differs from a share of an all-positive total. Positive contributions can exceed 100% of the net gain when losses elsewhere offset them. The signed contributions still add up to the whole; a small net denominator can make the shares look dramatic, and a zero denominator makes them undefined.
THE IDEA
Percentages of Net Changes
Percentages can mislead when the total combines positive and negative quantities. A profitable part of a business can contribute more than the business’s entire net profit if another part loses money. The arithmetic can be correct while the usual picture of slices adding up to a whole no longer fits.
For example, say I run a coffee shop. People, sad to say, are not buying my coffee; last month I lost $500 on that part of my business. Fortunately, I had the prescience to install a pastry case and a CD rack, and those two operations made a $750 profit each.
In all, I made $1000 this month, and 75% of that amount came from my pastry case. Which sounds like the pastry case is what’s really moving my business right now; almost all my profit is croissant-driven. Except that it’s just as correct to say that 75% of my profits came from the CD rack. And imagine if I’d lost $1000 more on coffee—then my total profit would be zero, so pastry’s share of that net profit would be undefined. “Seventy-five percent” sounds like it means “almost all,” but when you’re dealing with numbers that could be either positive or negative, like profits, it might mean something very different.
This problem never arises when you study numbers that are constrained to be positive, like expenses, revenues, or populations. If 75% of Americans think Paul McCartney was the cutest Beatle, then it’s not possible that another 75% give the nod to Ringo Starr; he, George, and John have to split the remaining 25% between them.
You can see this phenomenon in the jobs data, too. Spence and Hlatshwayo might have pointed out that about 600,000 jobs were created in finance and insurance; that’s almost 100% of the total jobs created by the tradable sector as a whole. They didn’t point that out, because they weren’t trying to trick you into believing that no other part of the economy was growing over that time span. Another part of the U.S. economy added many jobs from 1990 through the period covered by the study: the sector classified as “computer systems design and related services,” which tripled its job numbers, adding more than a million jobs all by itself. The total jobs added by finance and computers were way over the 620,000 jobs added by the tradable sector as a whole; those gains were balanced out by big losses in manufacturing. The combination of positive and negative allows you, if you’re not careful, to tell a fake story, in which the whole work of job creation in the tradable sector was done by the financial industry.
—
One can’t object very much to what Spence and Hlatshwayo wrote. It’s true, the total job growth in an aggregate of hundreds of industries can be negative, but in a normal economic context over a reasonably long time interval, it’s extremely likely to be positive. The population keeps growing, after all, and, absent total disaster, that tends to drag the absolute number of jobs along with it.
But other percentage flingers are not so careful. In June 2011, the Republican Party of Wisconsin issued a news release touting the job-creating record of Governor Scott Walker. It had been another weak month for the U.S. economy as a whole, which added only eighteen thousand jobs nationally. But the state employment numbers looked much better: a net increase of ninety-five hundred jobs. “Today,” the statement read, “we learned that over 50 percent of U.S. job growth in June came from our state.” The talking point was picked up and distributed by GOP politicians, like Representative Jim Sensenbrenner, who told an audience in a Milwaukee suburb, “The labor report that came out last week had an anemic eighteen thousand created in this country, but half of them came here in Wisconsin. Something we are doing here must be working.”
This is a perfect example of the soup you get into when you start reporting percentages of numbers, like net job gains, that might be either positive or negative. Wisconsin added ninety-five hundred jobs, which is good; but neighboring Minnesota, under Democratic governor Mark Dayton, added more than thirteen thousand in the same month. Texas, California, Michigan, and Massachusetts also outpaced Wisconsin’s job gains. Wisconsin had a good month, that’s true—but it didn’t contribute as many jobs as the rest of the country put together, as the Republican messaging suggested. In fact, what was going on is that job losses in other states almost exactly balanced out the jobs created in places like Wisconsin, Massachusetts, and Texas. That’s how Wisconsin’s governor could claim his state accounted for half the nation’s job growth, and Minnesota’s governor, if he’d cared to, could have said that his own state was responsible for 70% of it, and they could both, in this technically correct but fundamentally misleading way, be right.
Or take the New York Times op-ed by Steven Rattner discussed here. It used the work of economists Thomas Piketty and Emmanuel Saez to argue that the recovery then underway was unequally distributed among Americans:
New statistics show an ever-more-startling divergence between the fortunes of the wealthy and everybody else—and the desperate need to address this wrenching problem. Even in a country that sometimes seems inured to income inequality, these takeaways are truly stunning.
In 2010, as the nation continued to recover from the recession, a dizzying 93 percent of the additional income created in the country that year, compared to 2009—$288 billion—went to the top 1 percent of taxpayers, those with at least $352,000 in income. . . . The bottom 99 percent received a microscopic $80 increase in pay per person in 2010, after adjusting for inflation. The top 1 percent, whose average income is $1,019,089, had an 11.6 percent increase in income.
The article comes packaged with a handsome infographic that breaks the income gains up even further: 37% to the ultrarich members of the top 0.01%, with 56% to the rest of the top 1%, leaving a meager 7% for the remaining 99% of the population. You can make a little pie chart:
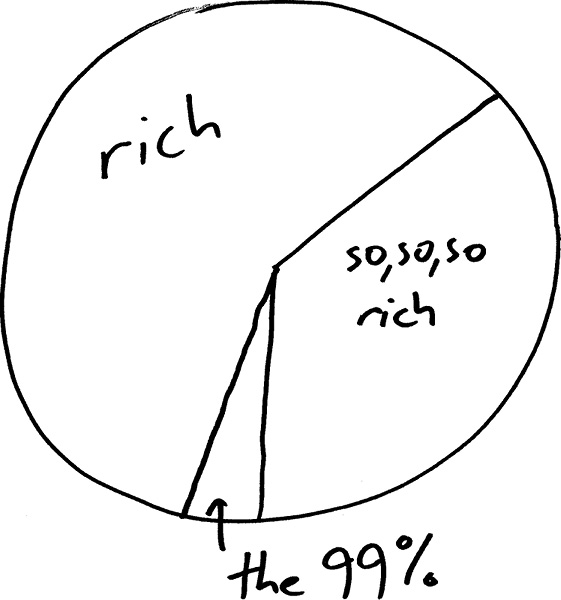
Now let’s slice the pie one more time, and ask about the people who are in the top 10%, but not the top 1%. Here you’ve got the family doctors, the non-elite lawyers, the engineers, and the upper-middle managers. How big is their slice? You can get this from Piketty and Saez’s data, which they’ve helpfully put online. And you find something curious. This group of Americans had an average income of about $159,000 in 2009, which increased to a little over $161,000 in 2010. That’s a modest gain compared to what the richest percentile racked up, but it still accounts for 17% of the total income gained between 2009 and 2010.
Try to fit a 17% slice of the pie in with the 93% share held by the one-percenters and you find you’ve got more pie than plate.
93% and 17% add up to more than 100%; how does this make sense? It makes sense because the bottom 90% actually had lower average income in 2010 than they did in 2009, recovery or no recovery. Negative numbers in the mix make percentages act wonky.
Looking at the Piketty-Saez data for different years, you see the same pattern again and again. In 1992, 131% of the national gains in income were accrued by the top 1% of earners! That’s certainly an impressive figure, but one which clearly indicates that the percentage doesn’t mean quite what you’re used to it meaning. You can’t put 131% in a pie chart. Between 1982 and 1983, as another recession retreated into memory, 91% of the national income gain went to the 10%-but-not-1% group. Does that mean that the recovery was captured by the reasonably wealthy professionals, leaving the middle class and the very rich behind? Nope—the top 1% saw a healthy increase that year too, accounting for 63% of the national income gain all by themselves. What was going on in both periods described here was that the bottom 90% continued to lose ground while the situation brightened for everybody else.
None of which is to deny that morning in America comes a little earlier in the day for the richest Americans than it does for the middle class. But it does put a slightly different spin on the story. It’s not that the 1% are benefitting while the rest of America languishes. The people in the top 10% but not the top 1%—a group that includes, not to put too fine a point on it, many readers of the New York Times opinion page—are doing fine too, capturing more than twice as much as the 7% share that the pie chart appears to allow them. It’s the other 90% of the country whose tunnel still looks dark at the end.
Even when the numbers involved happen to be positive, there’s room for spinners to tell a misleading story about percentages. In April 2012, Mitt Romney’s presidential campaign, facing poor poll numbers among women voters, released a statement asserting, “The Obama administration has brought hard times to American women. Under President Obama, more women have struggled to find work than at any other time in recorded history. Women account for 92.3% of all jobs lost under Obama.”
That statement is, in a manner of speaking, correct. According to the Bureau of Labor Statistics, total employment in January 2009 was 133,561,000, and in March 2012, just 132,821,000: a net loss of 740,000 jobs. Among women, the numbers were 66,122,000 and 65,439,000; so 683,000 fewer women were employed in March 2012 than in January 2009, when Obama took office. Divide the second number by the first and you get the 92% figure. It’s almost as if President Obama had been going around ordering businesses to fire all the women.
But no. Those numbers are net job losses. We have no idea how many jobs were created and how many destroyed over the three-year period; only that the difference of those two numbers is 740,000. The net job loss is positive sometimes, and negative other times, which is why taking percentages of it is a dangerous business. Just imagine what would have happened if the Romney campaign had started their count one month later, in February 2009. At that point, another brutal month into the recession, total employment was down to 132,837,000. Between then and March 2012, the economy suffered a net loss of just 16,000 jobs. Among women alone, the jobs lost were 484,000 (balanced, of course, by a corresponding gain for men). What a missed opportunity for the Romney campaign—if they’d started their reckoning in February, the first full month of the Obama presidency, they could have pointed out that women accounted for over 3,000% of all jobs lost on Obama’s watch!
But that would have signaled to any but the thickest voters that this percentage was somehow not the right measure.
What actually happened to men and women in the workforce between Obama’s inauguration and March 2012? Two things. Between January 2009 and February 2010, employment plunged for both men and women as the recession and its aftermath took their toll:
January 2009−February 2010:
Net job loss for men: 2,771,000
Net job loss for women: 1,546,000
And then, post-recession, the employment picture started slowly improving:
February 2010−March 2012:
Net job gain for men: 2,714,000
Net job gain for women: 863,000
During the steep decline, men took it on the chin, suffering almost twice as many job losses as women. And in the recovery, men account for 75% of the jobs gained. When you add both periods together, the men’s figures happen to cancel out almost exactly, leaving them with about as many jobs at the end as the beginning. But the idea that this entire economic period was almost exclusively bad for women is badly misguided.
The Washington Post graded the Romney campaign’s 92.3% figure as “ true but false.” That classification drew mockery by Romney supporters, but I think it’s just right, and has something deep to say about the use of numbers in politics. There’s no question about the accuracy of the number. You divide the net jobs lost by women by the net jobs lost, and you get 92.3%.
But that makes the claim “true” only in a very weak sense. It’s as if the Obama campaign had released a statement saying, “Mitt Romney has never denied allegations that for years he’s operated a bicontinental cocaine-trafficking ring in Colombia and Salt Lake City.”
That statement is also 100% true! But it’s designed to create a false impression. So “true but false” is a pretty fair assessment. It’s the right answer to the wrong question. Which makes it worse, in a way, than a plain miscalculation. It’s easy to think of the quantitative analysis of policy as something you do with a calculator. But the calculator enters only once you’ve figured out what calculation you want to do.
I blame word problems. They give a badly wrong impression of the relation between mathematics and reality. “Bobby has three hundred marbles and gives 30% of them to Jenny. He gives half as many to Jimmy as he gave to Jenny. How many does he have left?” That looks like it’s about the real world, but it’s just an arithmetic problem in a not very convincing disguise. The word “problem” has nothing to do with marbles. It might as well just say: type “300 − (0.30 × 300) − (0.30 × 300)/2=” into your calculator and copy down the answer!
But real-world questions aren’t like word problems. A real-world problem is something like “Has the recession and its aftermath been especially bad for women in the workforce, and if so, to what extent is this the result of Obama administration policies?” Your calculator doesn’t have a button for this. Because in order to give a sensible answer, you need to know more than just numbers. What shape do the job-loss curves for men and women have in a typical recession? Was this recession notably different in that respect? What kind of jobs are disproportionately held by women, and what decisions has Obama made that affect that sector of the economy? It’s only after you’ve started to formulate these questions that you take out the calculator. But at that point the real mental work is already finished. Dividing one number by another is mere computation; figuring out what you should divide by what is mathematics.
When to use it
Interpreting economic statistics from government or political campaigns.
Analyzing business profit breakdowns when some segments are loss-making.
Understanding income inequality data that uses percentage of total gains.
Evaluating job market reports that highlight net changes.
FROM THEORY TO EVERYDAY LIFE
In practice
Coffee Shop Profits
A coffee shop lost $500 on coffee but made $750 each on pastry and CD rack. Total profit is $1000, so each profitable activity contributes 75% of the net. Those positive shares add to 150%; the coffee loss offsets the excess. Reporting only the profitable activities obscures that loss.
Wisconsin vs. Minnesota Job Claims
Wisconsin added 9500 jobs in June 2011 and claimed 50% of national growth (total 18,000), but Minnesota added 13,000, and other states also added more. The claim was technically correct but misleading due to net losses elsewhere.
Piketty-Saez Income Data
In 2010, 93% of income gains went to the top 1%, but the top 10% (excluding top 1%) gained 17%, summing to 110% because the bottom 90% lost income.
Romney's 92.3% Job Loss Claim
Women accounted for 92.3% of net job losses under Obama, but this resulted from near cancellation of men's gains and losses; starting the count one month later would have given over 3000%.
A MOMENT TO REFLECT
Put it to work.
Can you think of a time when a percentage of a net change was used to mislead in a news report?
When a reported share of a net gain seems surprisingly large, what positive and negative contributions would you need to see?
How would you rephrase a claim like 'X accounts for 92% of job losses' to be more accurate?
References
- Spence and Hlatshwayo on job creation — Spence and Hlatshwayo
- Piketty and Saez income data — Thomas Piketty, Emmanuel Saez
- New York Times op-ed on income inequality — Steven Rattner
- Wisconsin Republican Party news release (June 2011) — Republican Party of Wisconsin (2011)
- Romney campaign statement on women and jobs (April 2012) — Mitt Romney presidential campaign (2012)
- Bureau of Labor Statistics employment data — Bureau of Labor Statistics
CONTINUE THE CONVERSATION
Source texts
- How Not to Be Wrong The Power of Mathematical Thinking (Ellenberg, Jordan)