Laffer Curve
The Laffer curve illustrates the nonlinear relationship between tax rates and government revenue, suggesting that higher tax rates can eventually reduce revenue by discouraging economic activity. It became a cornerstone of supply-side economics and tax-cut advocacy.
THE IDEA
SOMETHING-DOO ECONOMICS
The Laffer curve depicts a relationship between tax rates and government revenue that rises and then falls. It became influential in Republican economics during the debate over tax cuts. By the middle of the Reagan administration, the curve had become such a commonplace of economic discourse that Ben Stein ad-libbed it into his famous soul-killing lecture in Ferris Bueller’s Day Off:
Anyone know what this is? Class? Anyone? . . . Anyone? Anyone seen this before? The Laffer curve. Anyone know what this says? It says that at this point on the revenue curve, you will get exactly the same amount of revenue as at this point. This is very controversial. Does anyone know what Vice President Bush called this in 1980? Anyone? Something-doo economics. “Voodoo” economics.
The legend of the Laffer curve goes like this: Arthur Laffer, then an economics professor at the University of Chicago, had dinner one night in 1974 with Dick Cheney, Donald Rumsfeld, and Wall Street Journal editor Jude Wanniski at an upscale hotel restaurant in Washington, DC. They were tussling over President Ford’s tax plan, and eventually, as intellectuals do when the tussling gets heavy, Laffer commandeered a napkin and drew a picture. The picture looked like this:
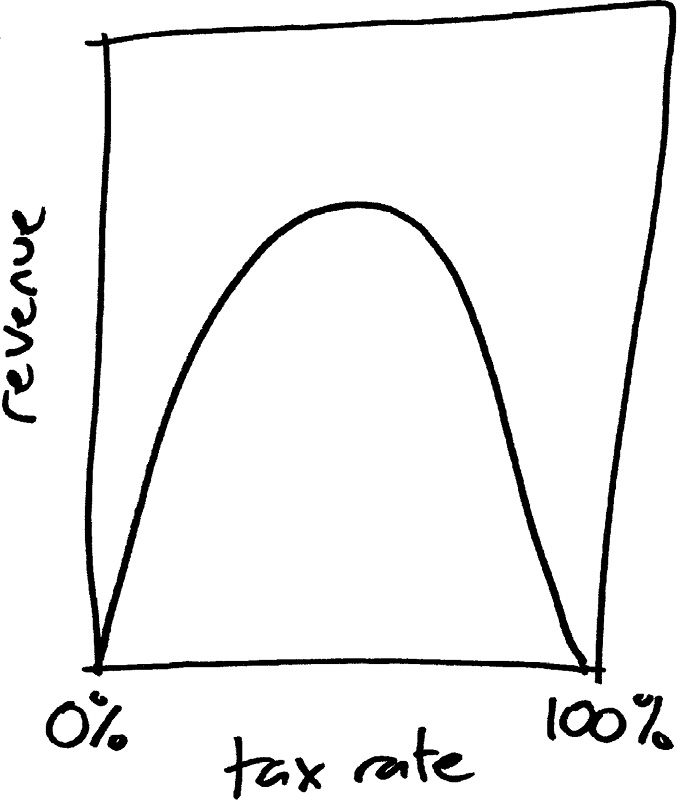
The horizontal axis here is level of taxation, and the vertical axis represents the amount of revenue the government takes in from taxpayers. On the left edge of the graph, the tax rate is 0%; in that case, by definition, the government gets no tax revenue. On the right, the tax rate is 100%; whatever income you have, whether from a business you run or a salary you’re paid, goes straight into Uncle Sam’s bag.
Which is empty. Because if the government vacuums up every cent of the wage you’re paid to show up and teach school, or sell hardware, or middle-manage, why bother doing it? Over on the right edge of the graph, people don’t work at all. Or, if they work, they do so in informal economic niches where the tax collector’s hand can’t reach. Under this simplifying assumption, the government’s revenue is zero once again.
In the intermediate range in the middle of the curve, where the government charges us somewhere between none of our income and all of it—in other words, in the real world— the government does take in some amount of revenue.
Given those assumptions and positive revenue at intermediate rates, the curve cannot be a straight line. If it were, revenue would be maximized at either the left or right edge of the graph; but it’s zero in both places. If the current income tax is really close to zero, so that you’re on the left-hand side of the graph, then raising taxes increases the amount of money the government has available to fund services and programs, just as you might intuitively expect. But if the rate is close to 100%, raising taxes actually decreases government revenue. If you’re to the right of the Laffer peak, and you want to decrease the deficit without cutting spending, there’s a simple and politically peachy solution: lower the tax rate, and thereby increase the amount of taxes you take in. Which way you should go depends on where you are.
So where are we? That’s where things get sticky. In 1974, the top income tax rate was 70%, and the idea that America was on the right-hand downslope of the Laffer curve held a certain appeal—especially for the few people lucky enough to pay tax at that rate, which only applied to income beyond the first $200,000. And the Laffer curve had a potent advocate in Wanniski, who brought his theory into the public consciousness in a 1978 book rather self-assuredly titled The Way the World Works. Wanniski was a true believer, with the right mix of zeal and political canniness to get people to listen to an idea considered fringy even by tax-cut advocates. He was untroubled by being called a nut. “Now, what does ‘nut’ mean?” he asked an interviewer. “ Thomas Edison was a nut, Leibniz was a nut, Galileo was a nut, so forth and so on. Everybody who comes with a new idea to the conventional wisdom, comes with an idea that’s so far outside the mainstream, that’s considered nutty.”
(Aside: it’s important to point out here that people with out-of-the-mainstream ideas who compare themselves to Edison and Galileo are never actually right. I get letters with this kind of language at least once a month, usually from people who have “proofs” of mathematical statements that have been known for hundreds of years to be false. I can guarantee you Einstein did not go around telling people, “Look, I know this theory of general relativity sounds wacky, but that’s what they said about Galileo!”)
The Laffer curve, with its compact visual representation and its agreeably counterintuitive sting, turned out to be an easy sell for politicians with a preexisting hunger for tax cuts. As economist Hal Varian put it, “You can explain it to a Congressman in six minutes and he can talk about it for six months.” Wanniski became an adviser first to Jack Kemp, then to Ronald Reagan, whose experiences as a wealthy movie star in the 1940s formed the template for his view of the economy four decades later. His budget director, David Stockman, recalls:
“ I came into the Big Money making pictures during World War II,” [Reagan] would always say. At that time the wartime income surtax hit 90 percent. “You could only make four pictures and then you were in the top bracket,” he would continue. “So we all quit working after about four pictures and went off to the country.” High tax rates caused less work. Low tax rates caused more. His experience proved it.
A claim that tax cuts will pay for themselves needs evidence about where the economy lies on the curve. The period considered here had a top rate of 35%, low compared with much of the twentieth century. But even in Reagan’s day, we were probably on the left-hand side of the curve. Greg Mankiw, an economist at Harvard and a Republican who chaired the Council of Economic Advisors under the second President Bush, writes in his microeconomics textbook:
Subsequent history failed to confirm Laffer’s conjecture that lower tax rates would raise tax revenue. When Reagan cut taxes after he was elected, the result was less tax revenue, not more. Revenue from personal income taxes (per person, adjusted for inflation) fell by 9 percent from 1980 to 1984, even though average income (per person, adjusted for inflation) grew by 4 percent over this period. Yet once the policy was in place, it was hard to reverse.
Some sympathy for the supply-siders is now in order. First of all, maximizing government revenue needn’t be the goal of tax policy. Milton Friedman, who did classified work for the Statistical Research Group during World War II, went on to become a Nobel-winning economist and adviser to presidents, and a powerful advocate for low taxes and libertarian philosophy. Friedman’s famous slogan on taxation is “I am in favor of cutting taxes under any circumstances and for any excuse, for any reason, whenever it’s possible.” He didn’t think we should be aiming for the top of the Laffer curve, where government tax revenue is as high as it can be. For Friedman, money obtained by the government would eventually be money spent by the government, and that money, he felt, was more often spent badly than well.
More moderate supply-side thinkers, like Mankiw, argue that lower taxes can increase the motivation to work hard and launch businesses, leading eventually to a bigger, stronger economy, even if the immediate effect of the tax cut is decreased government revenue and bigger deficits. An economist with more redistributionist sympathies would observe that this cuts both ways; maybe the government’s diminished ability to spend means it constructs less infrastructure, regulates fraud less stringently, and generally does less of the work that enables free enterprise to thrive.
Mankiw also points out that the very richest people—the ones who’d been paying 70% on the top tranche of their income—did contribute more tax revenue after Reagan’s tax cuts. That leads to the somewhat vexing possibility that the way to maximize government revenue is to jack up taxes on the middle class, who have no choice but to keep on working, while slashing rates on the rich; those guys have enough stockpiled wealth to make credible threats to withhold or offshore their economic activity, should their government charge them a rate they deem too high. If that story’s right, a lot of liberals will uncomfortably climb in the boat with Milton Friedman: maybe maximizing tax revenue isn’t so great after all.
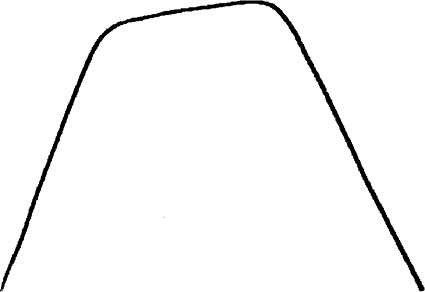
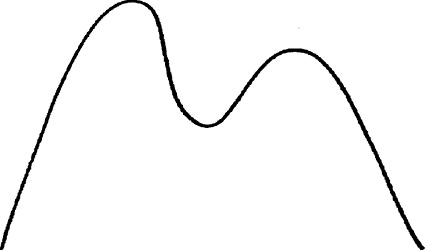
Mankiw’s final assessment is a rather polite “Laffer’s argument is not completely without merit.” I would give Laffer more credit than that! His drawing made the fundamental and incontrovertible mathematical point that under his assumptions, the relationship between taxation and revenue is nonlinear. It doesn’t, of course, have to be a single smooth hill like the one Laffer sketched; it could look like a trapezoid
or a Bactrian camel’s back
or a wildly oscillating free-for-all
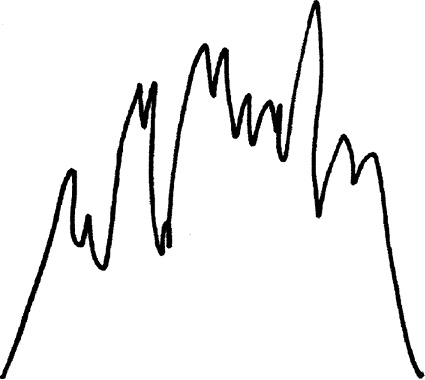
but if it slopes upward in one place, it has to slope downward somewhere else. There is such a thing as being too Swedish. That’s a statement no economist would disagree with. It’s also, as Laffer himself pointed out, something that was understood by many social scientists before him. But to most people, it’s not at all obvious—at least, not until you see the picture on the napkin. Laffer understood perfectly well that his curve didn’t have the power to tell you whether or not any given economy at any given time was overtaxed or not. That’s why he didn’t draw any numbers on the picture. Questioned during congressional testimony about the precise location of the optimal tax rate, he conceded, “I cannot measure it frankly, but I can tell you what the characteristics of it are; yes, sir.” All the Laffer curve says is that lower taxes could, under some circumstances, increase tax revenue; but figuring out what those circumstances are requires deep, difficult, empirical work, the kind of work that doesn’t fit on a napkin.
There’s nothing wrong with the Laffer curve—only with the uses people put it to. Wanniski and the politicians who followed his panpipe fell prey to the oldest false syllogism in the book:
It could be the case that lowering taxes will increase government revenue;
I want it to be the case that lowering taxes will increase government revenue;
Therefore, it is the case that lowering taxes will increase government revenue.
When to use it
Debating tax policy: using the Laffer curve to argue that tax cuts can stimulate economic growth and potentially increase revenue, even though the effect is uncertain.
Analyze a historical tax reform by comparing observed revenue with estimates of what would have happened without the reform.
Understanding taxpayer behavior: predicting how high-income earners might respond to top marginal tax rates by working less, moving, or hiding income.
FROM THEORY TO EVERYDAY LIFE
In practice
Reagan Tax Cuts of 1981
The account describes Reagan’s cut in top rates from 70% to 50% and cites a 9% fall in inflation-adjusted personal income tax revenue per person from 1980 to 1984. It also notes increased contributions from the richest taxpayers. Those observations inform the debate, but locating the revenue-maximizing rate requires examining other influences on revenue as well.
Laffer's Napkin Drawing
In the account of the 1974 dinner, Arthur Laffer sketched a curve with revenue at zero under a 0% rate and, by assumption, under a 100% rate. Positive revenue between those endpoints illustrates why a tax rate’s effect depends on where it lies on the curve.
A MOMENT TO REFLECT
Put it to work.
How can we empirically determine whether a given economy is on the left or right side of the Laffer curve?
What assumptions must hold for a tax cut to increase government revenue?
In what other policy domains might a similar nonlinear relationship exist (e.g., regulation, pollution, advertising)?
Often confused with
References
- The Way the World Works — Jude Wanniski (1978)
- Principles of Microeconomics (textbook) — N. Gregory Mankiw
- Milton Friedman's tax philosophy (various works) — Milton Friedman
- Ferris Bueller's Day Off (film) — Ben Stein (actor) (1986)
CONTINUE THE CONVERSATION
Source texts
- How Not to Be Wrong The Power of Mathematical Thinking (Ellenberg, Jordan)