Data Selection and Sampling
Sampling determines which observations support a decision and which population the findings can describe. Define that population, examine who is reachable and who is missing, and choose a sample size and time window suited to the question.
THE IDEA
Data Selection
Using data to guide a decision involves three connected steps: data selection → data analyses → result interpretation. Poor selection limits what even a careful analysis can tell us—the familiar GIGO, or garbage-in, garbage-out, problem. Sampling means selecting units, such as people, purchases or insurance claims, from a population of interest. Whether the findings can be generalized depends on how those units were selected and which units were left out. Figure 2.1 outlines the process.
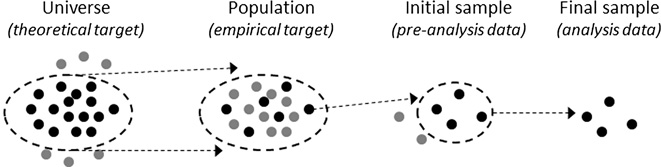
FIGURE 2.1 The Generalized Sampling Process.
The universe → population → initial sample → final sample progression in Figure 2.1 separates the group we want to understand from the observations we can actually analyze. The source calls the broad target the universe and its reachable subset the population. For a marketing study, the universe might include all purchasers of a brand, while the reachable group consists of identifiable loyalty-program members. For an insurance study, the broad target might be all personal automotive claims during a period, while accessible records come from a particular insurer. These restrictions matter: loyalty members may differ from other buyers, and one insurer’s claims may not represent the whole market.
An initial sample selects observations from the reachable group, perhaps within a region or time window. Preparing the final sample involves checking records, missing values and unusual observations. An extreme value may be a data error, but it may also be a genuine large purchase or costly claim. Removing valid extremes merely because they are inconvenient changes what the sample represents. Cleaning decisions should follow the question and be documented.
Projectability asks whether sample estimates can reasonably describe the target population. Every sample leaves some uncertainty. The sampling technique 5, coverage of the target group and patterns of nonresponse all affect that uncertainty and the risk of bias. A large sample drawn from the wrong group does not automatically become representative. Check how the people or events included differ from those missing, especially on characteristics relevant to the result.
Recency concerns how old the data are. Recent observations may better reflect current conditions, but a short window can mistake a temporary fluctuation for a lasting trend. Older data help reveal patterns over time, though they can also describe conditions that no longer apply. Choose the time window by considering the decision, changes in the process and the need to distinguish a trend from noise. There is no universally correct cutoff.
Sample size affects precision. A small sample can leave estimates too uncertain for the decision. A large sample can detect very small differences,6 including differences with little practical value. That is a reason to examine effect size and uncertainty alongside statistical significance, rather than to discard useful data. Plan the sample around the effect that would matter and the precision needed to assess it.
When to use it
Designing a customer survey: define the target customers, identify whom you can reach, select respondents and assess nonresponse before generalizing.
Analyzing clinical trial results: selecting a sample of patients from a broader population, ensuring projectability to the target patient group.
Forecasting sales: deciding how far back to pull historical data to balance recency with trend stability.
Planning an A/B test around a meaningful effect size, then assessing its magnitude and uncertainty alongside statistical significance.
FROM THEORY TO EVERYDAY LIFE
In practice
Marketing Analysis Sampling
A marketing study targets all purchasers of a brand but can contact only loyalty-program members. It samples those members within a region and time window, checks the records, and examines how excluding other buyers may limit the findings.
Insurance Claim Analysis Sampling
An insurance analyst has claims from a particular company and period. Before generalizing to the wider market, the analyst checks differences in policyholders and coverage. Unusually large claims are investigated; valid claims remain part of the risk picture.
A MOMENT TO REFLECT
Put it to work.
Think of a recent decision you made using data. How were the observations selected, and who or what was missing?
When evaluating a study, how do you assess whether the sample is representative of the population?
How might focusing only on the most recent data affect your long-term forecasts? Can you think of a situation where older data is more valuable?
CONTINUE THE CONVERSATION
Source texts
- Evidence-Based Decision-Making How to Leverage Available Data and Avoid Cognitive Biases (Andrew D. Banasiewicz)