Cross-Cultural Differences in Overconfidence (Probability Judgment across Cultures)
Research on overconfidence in probability judgments reveals significant cross-cultural variations: contrary to intuitive beliefs, Asian respondents often exhibit greater overconfidence than Westerners when assessing the correctness of their general knowledge. This chapter explores the causes, generalizability, and implications of these differences.
THE IDEA
CONCLUDING REMARKS (from previous section)
Everyone makes predictions about the future, paupers and princes alike. Tony Blair, British Prime Minister, illustrated this in his own paradoxical manner, proclaiming ”I don’t make predictions. I never have, and I never will.” Problems of planning and prediction are fascinating to research because of their relevance to our own daily lives. Beyond this, there are at least three important reasons why this area of research is so close to our hearts. First, it provides a clear and simple testing ground for many of the theoretical statements developed in the heuristics and biases tradition. Here, there is no need to import any theory of probability or logic – accuracy and bias can be measured by the calendar and the clock. Second, improving the accuracy of project forecasting has the potential to provide huge applied benefits. Third, and most generally, the problem of integrating the memories of the past into our understanding of the present and our expectations for the future is a central human challenge that we all face in every domain of our social lives. Inside the planning fallacy we can discover insights about how hope, fear, disappointment, and reason combine to shape predictions and many other expectations for the future.
* This program of research has been supported by grants from the Social Sciences and Humanities Research Council of Canada.
15. Probability Judgment across Cultures *
J. Frank Yates, Ju-Whei Lee, Winston R. Sieck, Incheol Choi, and Paul C. Price
Consider the following general knowledge question:
Is jute (circle one):
(a) a cereal crop
or
(b) a fiber crop?
Now indicate the probability (50–100%) that your chosen answer is correct: ___________%
In a series of studies, George Wright and Lawrence Phillips, along with several collaborators, posed questions like these to respondents in Britain and in various Southeast Asian sites, including Hong Kong, Malaysia, and Indonesia. Figure 15.1 displays illustrative results from one of those studies (Wright et al., 1978) in the form of calibration curves (see also Phillips & Wright, 1977; Wright & Phillips, 1980). The abscissa shows the various probability judgments the participants rendered, rounded to the nearest 10%. The ordinate displays the corresponding proportions of correct answers. Consider, for example, the open point on the British curve above assessed probability 0.7. It indicates that, when the British respondents reported that they were 70% sure that their chosen answers were correct, about 62% of the time those answers really were correct. When judged probabilities tend to exceed proportions correct, the judgments are said to be overconfident. Overconfidence is the most common and frequently discussed finding in general-knowledge studies (Lichtenstein, Fischhoff, & Phillips, 1982). The phenomenon is manifested in general-knowledge question calibration curves when the curves are displaced to the right of the 1:1 diagonal. What is immediately evident in Fig. 15.1 is that in the Wright et al. (1978) study, overconfidence was markedly and consistently greater among the respondents in Asia than among those in Britain.
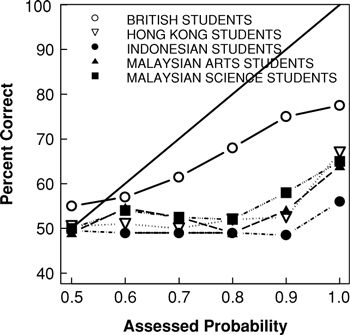
Figure 15.1. Calibration curves for respondents in Britain, Hong Kong, Indonesia, and Malaysia. Redrawn from Wright et al. (1978), Fig. 1, with permission.
It is useful to have a simple summary measure of overconfidence. The bias or over/underconfidence index serves that purpose:
| image | (1) |
Bias is the now-standard measure of the strength of overconfidence (when positive) or underconfidence (when negative). It would not be atypical to observe that, on average, a respondent says there is a 73% chance that his chosen answers are correct, but only 65% of those answers really are correct, implying a bias of 8%. Although Wright et al. (1978) did not actually report bias statistics, an inspection of Fig. 15.1 makes it obvious that the average bias would have been much higher for their Asian respondents than for their British counterparts. After all, every point on the calibration curves for the former is lower than the corresponding point on the curve for the latter.
Results like those depicted in Fig. 15.1 challenge people’s intuitive beliefs about cultural differences. Yates, Lee, and Shinotsuka (1996) explained the general knowledge question paradigm to respondents in the United States and Taiwan, much the way we described it previously. Respondents were then asked to indicate whether they would expect overconfidence to be greater in the United States, in Taiwan, or the same in both places. A significant majority of the respondents (∼62%) expected stronger overconfidence among Americans than among Chinese in Taiwan; fewer than 14% anticipated the reverse. This expectation of greater American overconfidence held regardless of whether respondents were in the United States or in Taiwan and whether or not the expression overconfidence was used when the concept was introduced.
Why are people’s intuitions about Asian–Western differences in overconfidence so far off the mark? What do the findings in Fig. 15.1 mean? The purpose of this chapter is to summarize what we and others have learned about these issues. The sections of the chapter are organized according to the various questions that have been addressed:
• Are indications of greater Asian overconfidence mere artifacts of research procedure?
• Do the previously observed cross-cultural variations generalize – to other cultures, other target events besides the correctness of answers to categorical general-knowledge questions, and aspects of accuracy other than overconfidence?
• What explains the variations that exist?
• Finally, what do these variations imply for our understanding of fundamental principles of judgment and decision making and for practical affairs in arenas such as intercultural collaborations and commerce?
When to use it
International business negotiations: Understanding that partners from different cultures may have systematically different confidence levels can help avoid miscommunication or overcommitment.
Cross-cultural teamwork: When evaluating project timelines or risk assessments, be aware that team members from cultures with higher overconfidence may provide overly optimistic estimates.
Educational testing: When designing multiple-choice tests in multicultural settings, consider that confidence assessments may be biased by cultural norms, affecting self-assessment and learning.
Financial forecasting: Analysts working in global markets should adjust for cultural differences in probability judgments when aggregating predictions from diverse sources.
FROM THEORY TO EVERYDAY LIFE
In practice
Jute Crop Question: Cross-Cultural Overconfidence
In a study by Wright et al. (1978), participants from Britain, Hong Kong, Indonesia, and Malaysia were asked a general knowledge question: 'Is jute a cereal crop or a fiber crop?' They then indicated their confidence (50–100%) in their answer. The results showed that Asian respondents were more overconfident (their confidence exceeded actual accuracy) compared to British respondents, as illustrated by calibration curves shifted further from the diagonal.
Intuitive Beliefs About American vs. Asian Overconfidence
Yates, Lee, and Shinotsuka (1996) asked participants in the U.S. and Taiwan which group they thought would show greater overconfidence. About 62% expected greater overconfidence among Americans, but actual data (e.g., from Wright et al.) showed the opposite—greater overconfidence among Asians. Intuitive expectations about cultural differences can be mistaken.
A MOMENT TO REFLECT
Put it to work.
How might your own cultural background influence the way you calibrate confidence when making predictions or judgments?
Think of a recent decision where you were highly confident. Was your confidence justified? How could you test your calibration?
Why do you think people intuitively expect Americans to be more overconfident than East Asians, despite evidence to the contrary? What does that tell us about cultural stereotypes?
Often confused with
References
- Overconfidence in General Knowledge: A Cross-Cultural Comparison — Wright, G., Phillips, L. D., Whalley, P. C., Choo, G. T., Ng, K. O., Tan, I., & Wisudha, A. (1978)
- Cultural Variation in Probabilistic Thinking — Phillips, L. D., & Wright, G. N. (1977)
- Cultural Variation in Probabilistic Thinking: Alternative Ways of Dealing with Uncertainty — Wright, G. N., & Phillips, L. D. (1980)
- Calibration of Probabilities: The State of the Art to 1980 — Lichtenstein, S., Fischhoff, B., & Phillips, L. D. (1982)
- Beliefs About Overconfidence, Including Its Cross-Cultural Variation — Yates, J. F., Lee, J.-W., & Shinotsuka, H. (1996)
CONTINUE THE CONVERSATION
Source texts
- Heuristics and Biases The Psychology of Intuitive Judgment (Thomas Gilovich, Dale Griffin, Daniel Kahneman)