Causal Loop Analysis (Causal Loop Diagrams)
Causal loop analysis uses diagrams to map the causal relationships and feedback loops within a system, helping to understand how different factors influence each other over time. It distinguishes between reinforcing loops (amplifying change) and balancing loops (resisting change).
THE IDEA
Illustrating the Power of Thinking in Systems – Causal Loop Analysis
Let's consider a simple example and see the power of systems thinking using causal loop analysis.
Suppose you consider sales of electric cars or vehicles (EVs henceforth). In that case, the number of positive customer experiences can generate good reviews and, in due course, positively impact sales. But, on the other hand, as more EVs are sold, there will be an impact on another system – the system for building and maintaining EV charging points (commonly called EV supply equipment or EVSE). So, if the number of available EVSEs cannot keep pace with the number of EVs on the road, more EV drivers will be waiting to charge their cars, especially at peak times and locations. And if this continues, it may generate dissatisfaction for some EV users, who will tell their friends and family, and which may eventually impact new sales to people who don't want to be ‘caught out’ without an available car charging point during an important journey.
These effects can be understood in terms of ‘causal loops’, with positive impacts called ‘reinforcing loops’ and negative impacts called ‘balancing loops’, set out in Diagram 3.2.
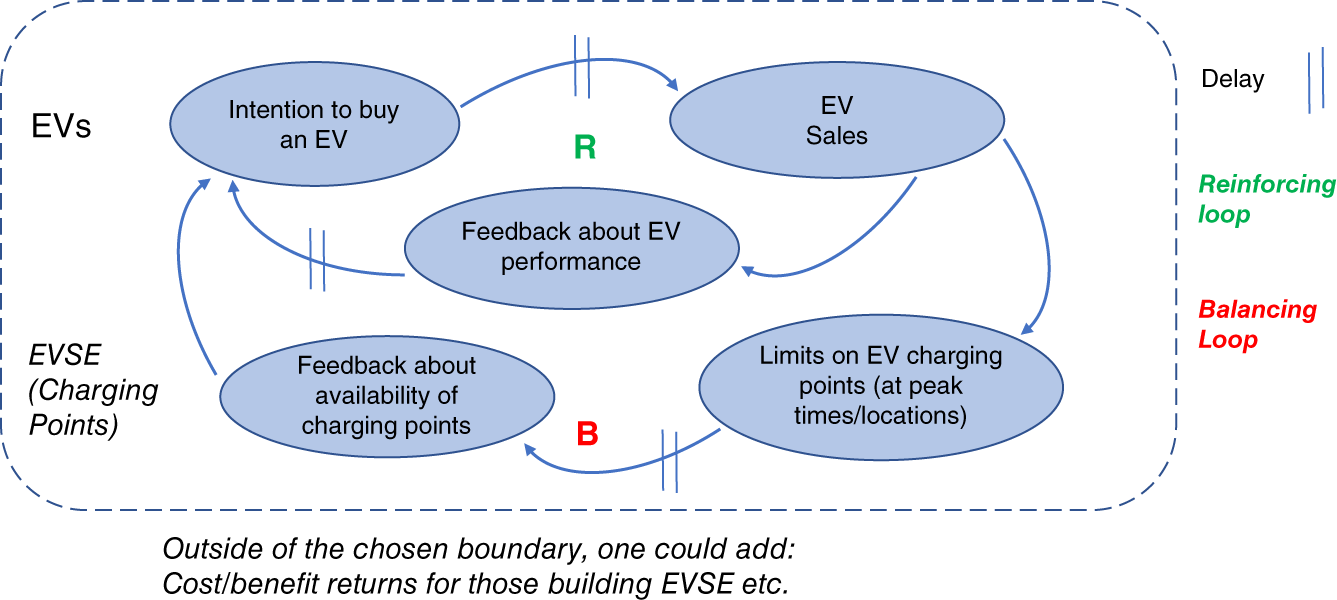
Diagram 3.2 Electric vehicle sales, impact of charging points (causal loop diagram)
Although Diagram 3.2 repeats the written explanation, it does so with just a few simple symbols and highlights that growth in EV numbers isn't only about how good the EVs are. Instead, there are other factors upon which EV sales rely. The diagram also contains a ‘boundary’ to highlight whether other factors, which may be relevant (such as the incentives for those building EVSEs, etc.), are included in any analysis or not.
From a simple causal loop diagram, you can build up the causes and effects of multiple elements, all potentially relevant to an area. Donella Meadows explained, ‘Everything you know … is only a model. Get your model out … where it can be viewed. Invite others to challenge your assumptions and add their own’.
So, causal loop diagrams can be used to:
- picture the critical elements involved in an area of interest,
- clarify how they are related (e.g. directly or indirectly, and why),
- find new ways to understand what the real challenges are (e.g. where constraints or dependencies may be impacting behaviour), and
- consider different courses of action and their effects over different periods, e.g. ‘If we do X, we should get Y, but might we see any spin‐off problems?’ And it can also help you think, ‘If we see Z, what might be causing this, and what might we do about it?’
When to use it
Analyzing the growth of a new technology adoption and its infrastructure dependencies.
Understanding the dynamics of customer satisfaction and word-of-mouth in a business.
Modeling the effects of policy changes on complex social systems.
Identifying leverage points in organizational change efforts.
FROM THEORY TO EVERYDAY LIFE
In practice
Electric Vehicle Sales and Charging Infrastructure
The number of positive customer experiences with EVs generates good reviews, which positively impact sales. However, as EV sales increase, the demand for charging points (EVSE) also increases. If the number of charging points cannot keep pace, drivers face long waits, leading to dissatisfaction and negative word-of-mouth, which can reduce future sales. Sales growth forms a reinforcing loop; the infrastructure constraint forms a balancing loop.
A MOMENT TO REFLECT
Put it to work.
How can you identify the reinforcing and balancing loops in a system you are part of?
What might be the unintended consequences of focusing only on one causal loop in your analysis?
In the EV example, what other factors could be included within the boundary of the analysis?
CONTINUE THE CONVERSATION
Source texts
- Beyond the Five Whys Root Cause Analysis and Systems Thinking (James C. Paterson)