Calibration of Uncertainty Assessments
Calibration compares reported uncertainty with observed variation. The Birge ratio compares dispersion across measurements with their reported standard errors. A ratio substantially above 1 can flag underestimated uncertainty or a failure of the model’s other assumptions.
THE IDEA
MEASURES OF CALIBRATION
One can obtain some empirical insights into the calibration of a set of assessments by comparing reported uncertainties with the variability among the measurements. Suppose each experiment i, for i = 1, 2, ..., N, reports an estimate x_i with standard error σ_i, and  is the group mean, weighted inversely by the variances. The sum of the squares of the normalized residuals, h_i = (x_i − ) / σ_i, should be distributed as the chi-squared statistic with (N − 1) degrees of freedom, assuming the errors are independent and normally distributed with the reported standard deviations. This statistic can then be used to test the appropriateness of these assumptions.
A related measure, the Birge ratio, R_B (Birge, 1932), assesses the compatibility of a set of measurements by comparing the variability among experiments to the reported uncertainties. It may be defined as the standard deviation of the normalized residuals:
R_B = \sqrt{ \frac{1}{N-1} \sum_{i=1}^N h_i^2 } — Figure unavailable in the source files.
Alternatively, the Birge ratio may be seen as a measure of the appropriateness of the reported uncertainties. Under the stated independent normal-error assumptions, the expectation of the square of R_B is 1. If R_B is much greater than 1, then one or more of the experiments has underestimated its uncertainty and may contain unrecognized systematic errors. Such insensitivity to systematic error is a sign of overconfidence. If R_B is much less than 1, then either the uncertainties have, in the aggregate, been overestimated or the errors are correlated.
UNCERTAINTY IN c
The velocity of light, c, is perhaps the most measured fundamental physical constant (Pipkin & Ritter, 1983), starting with Galileo's unsuccessful attempts, using assistants flashing lanterns on neighboring hills. Figure 37.1 displays the results of all measurements between 1875 and 1958 with reported uncertainty from several major surveys (Froome & Essen, 1969; Taylor, Parker, & Langenberg, 1969; Birge, 1932, 1942; Rush, 1955). The vertical bars represent the standard error according to the original experiment or earliest reviewer. The horizontal dashed line is the 1984 value of 299,792.458 km/s.
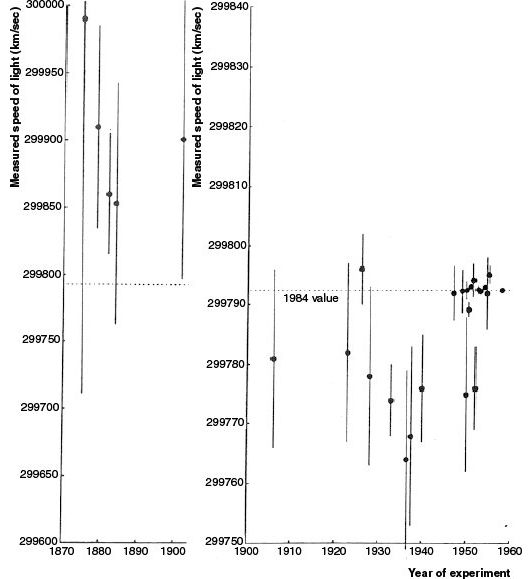
The Birge ratio for the entire set of 27 measurements with errors relative to the 1984 value is 1.42. The probability of finding such large variability by chance is less than 0.005, assuming that the errors were normally distributed with the reported standard deviations. If the standard deviations of the discrepant studies fully express the respective investigators' uncertainties regarding their estimates, then, on average, those uncertainties must be significantly underestimated.
Over time, both the reported uncertainty and the actual error of these estimates have been reduced enormously. There was, however, no significant corresponding improvement in the Birge ratio, which was 1.47 for measurements up to 1941 and 1.32 since 1947 (top of Table 37.1). For both periods, the variability was significantly greater than one would expect, indicating unduly tight uncertainty estimates.
When to use it
Evaluating the reliability of scientific measurements in metrology and experimental physics.
Assessing the calibration of expert judgments in risk analysis and forecasting.
Improving confidence intervals in personal decision-making by tracking calibration over time.
Auditing the uncertainty estimates in financial models or engineering calculations.
FROM THEORY TO EVERYDAY LIFE
In practice
Speed of Light Measurements (1875–1958)
The Birge ratio for 27 measurements of the speed of light was 1.42, indicating that the reported uncertainties were systematically too tight. This overconfidence persisted even as measurement techniques improved, with ratios of 1.47 before 1941 and 1.32 after 1947.
A MOMENT TO REFLECT
Put it to work.
For a series of predictions with confidence intervals, how often did the outcomes fall inside the intervals? How does that coverage compare with the confidence levels you reported?
Consider a set of similar estimates you have made—how would you calculate a Birge ratio for your own assessments? What would it say about your tendency toward overconfidence or underconfidence?
When you see a scientific result with reported error bars, how often do you check whether the uncertainty is realistic? What might a high Birge ratio imply about the field?
References
- — Birge, R. T. (1932)
CONTINUE THE CONVERSATION
Source texts
- Heuristics and Biases The Psychology of Intuitive Judgment (Thomas Gilovich, Dale Griffin, Daniel Kahneman)