Calibration and Miscalibration
Calibration refers to how well subjective probability judgments match objective relative frequencies. Miscalibration can take forms including overprediction, underprediction, overextremity (too radical), and underextremity (too conservative), often driven by heuristics and task difficulty.
THE IDEA
Calibration and Miscalibration
Miscalibration presents itself in a number of forms. Figure 39.1 displays four typical patterns of miscalibrated probability judgments. The solid diagonal line, identity line, or line of perfect calibration, indicates the set of points at which judged probability and relative frequency coincide. The solid line marked A, where all judgments are higher than the corresponding relative frequency, represents overprediction bias. The solid line marked B, where all judgments are lower than the corresponding relative frequency, represents underprediction bias. The dotted line marked C, where judgments lower than 50% are too low and judgments higher than 50% are too high, represents overextremity bias. The dotted line marked D, where judgments lower than 50% are too high and judgments higher than 50% are too low, represents underextremity bias. Note that overextremity entails overly radical judgments (too close to 0 and 100) and underextremity entails overly conservative judgments (too far from 0 and 100). Combinations of under- or overprediction and either of the extremity biases are also possible, and result in lines that cross the diagonal at points other than 50%. Overconfidence, the poster child of judgmental biases, is a simple summary term (average subjective probability minus overall outcome relative frequency) that does not uniquely identify any one of these patterns (Wallsten & Budescu, 1983). Nonetheless, when referring to previous research, we use the term overconfidence, as this simple bias measure is often the primary statistic reported.
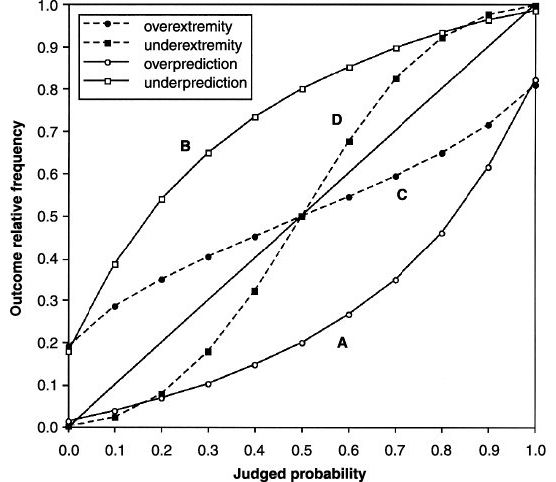
Figure 39.1. Calibration curves, generated by RST simulations, illustrating distinction between miscalibration due to overprediction (or underprediction) of target event versus that due to judgments which are overly (or insufficiently) extreme.
Note: Neglect model predictions based on RST simulation assuming no focal bias (β=0) and fixed judgmental extremity (σ=1). Over- and underprediction curves constructed assuming fixed discriminability (α=1) with varying target event base rate (BR=20% for overestimation; BR=80% for underestimation). Over- and underextremity curves constructed assuming fixed base rate (BR=50%) with varying discriminability (α=2.0 for overextremity; α=0.5 for underextremity).
Each of the four patterns illustrated in Fig. 39.1 is consistent with the use of judgmental heuristics (e.g., Kahneman & Tversky, 1973), and the pattern found depends on specific qualities of the judgmental task or situation and how they interact with the relevant heuristics (Griffin & Tversky, 1992; Griffin, Gonzalez, & Varey, 2000). The neglect of base rates that follows from reliance on judgmental heuristics leads to overprediction bias (A) when the outcome base rate is low and underprediction bias (B) when the outcome base rate is high. The neglect of evidence quality that follows from reliance on judgmental heuristics leads to overextremity bias (C) when the evidence quality is low and underextremity bias (D) when the evidence quality is high. The dependence of miscalibration upon the difficulty of the task and the knowledge of the judge (the difficulty or hard–easy effect) was established as the fundamental bias in general knowledge calibration by Lichtenstein, Fischhoff, and Philips (1982) in their comprehensive review. Nonetheless, general claims about the ubiquity of "overconfidence" continue to dominate managerial and academic textbooks.
When to use it
A project manager estimating the probability of meeting a deadline tends to be overconfident if the task is complex, leading to overextremity (hard-easy effect).
A weather forecaster calibrates rain probability predictions; on days with strong evidence but low base rate, forecasters may overpredict rain.
A financial analyst predicting stock returns should be aware of overextremity when evidence quality is low and adjust confidence accordingly.
A doctor diagnosing a rare disease should consider the low base rate to avoid overprediction bias and give more accurate probability estimates.
FROM THEORY TO EVERYDAY LIFE
In practice
Medical Diagnosis Overprediction
Suppose a doctor repeatedly assigns a 30% disease probability to a group of comparable patients, but only 10% of those patients have the disease. That pattern is overprediction. Neglect of a low base rate is one possible explanation, but the calibration result alone does not establish its cause.
Stock Market Overextremity
Suppose an analyst’s 90% forecasts of a stock rising succeed only 70% of the time. Those forecasts are too high. To identify overextremity, also examine forecasts at the low end: they should be too low, with both ends pulled too close to the extremes, including 100%. A single high-probability group cannot distinguish overextremity from general overprediction.
A MOMENT TO REFLECT
Put it to work.
Review a set of probability forecasts and their outcomes. Do the observed frequencies suggest overprediction, underprediction, overextremity, or underextremity? What further evidence would help explain the pattern?
How does the difficulty of a task affect your confidence? Can you think of an example where you were overconfident on a hard task or underconfident on an easy one?
Consider a decision you made based on a subjective probability. Did you neglect the base rate or the quality of evidence? How might adjusting for these improve your calibration?
Often confused with
References
- Calibration of probability judgments — Wallsten & Budescu (1983)
- On the psychology of prediction — Kahneman & Tversky (1973)
- The weighing of evidence and the determinants of confidence — Griffin & Tversky (1992)
- Judgmental extremeness and the difficulty effect — Griffin, Gonzalez, & Varey (2000)
- Calibration of probabilities: The state of the art to 1980 — Lichtenstein, Fischhoff, & Philips (1982)
CONTINUE THE CONVERSATION
Source texts
- Heuristics and Biases The Psychology of Intuitive Judgment (Thomas Gilovich, Dale Griffin, Daniel Kahneman)